
What is the ADX for?
Many indicators give a direction, but few say whether the move has enough strength to be worth acting on. The ADX (Average Directional Index), created by J. Welles Wilder, answers that question: it measures the strength of a trend, whatever its direction. A low ADX means a market with no clear trend; a high ADX means a clear move, up or down. The DMI (Directional Movement Index) adds two lines, +DI and −DI, which tell you which side the pressure comes from.
How it is calculated
- On each candle, compare with the previous one: +DM is the rise of the high, −DM is the fall of the low (only the larger of the two counts, and only if it is positive). TR is the candle’s true range.
- Each series is smoothed over 14 candles with Wilder’s average, a slow-reacting average. +DI = 100 × (smoothed +DM ÷ smoothed TR); −DI = 100 × (smoothed −DM ÷ smoothed TR).
- DX = 100 × |+DI − −DI| ÷ (+DI + −DI): the relative gap between the two lines. The ADX is Wilder’s smoothing of the DX over 14 candles.
- By construction the ADX is slow: it only starts after 2 × 14 = 28 candles. It does not repaint.
Reading the signal in Algo Signals
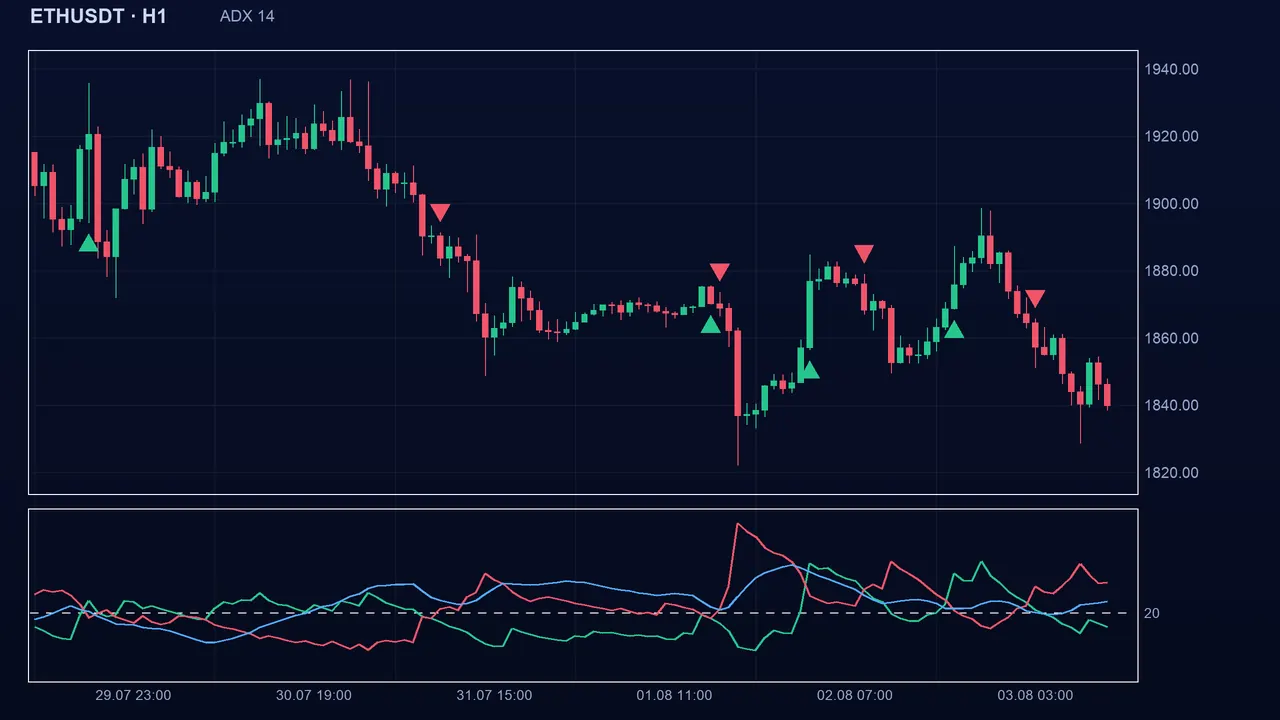
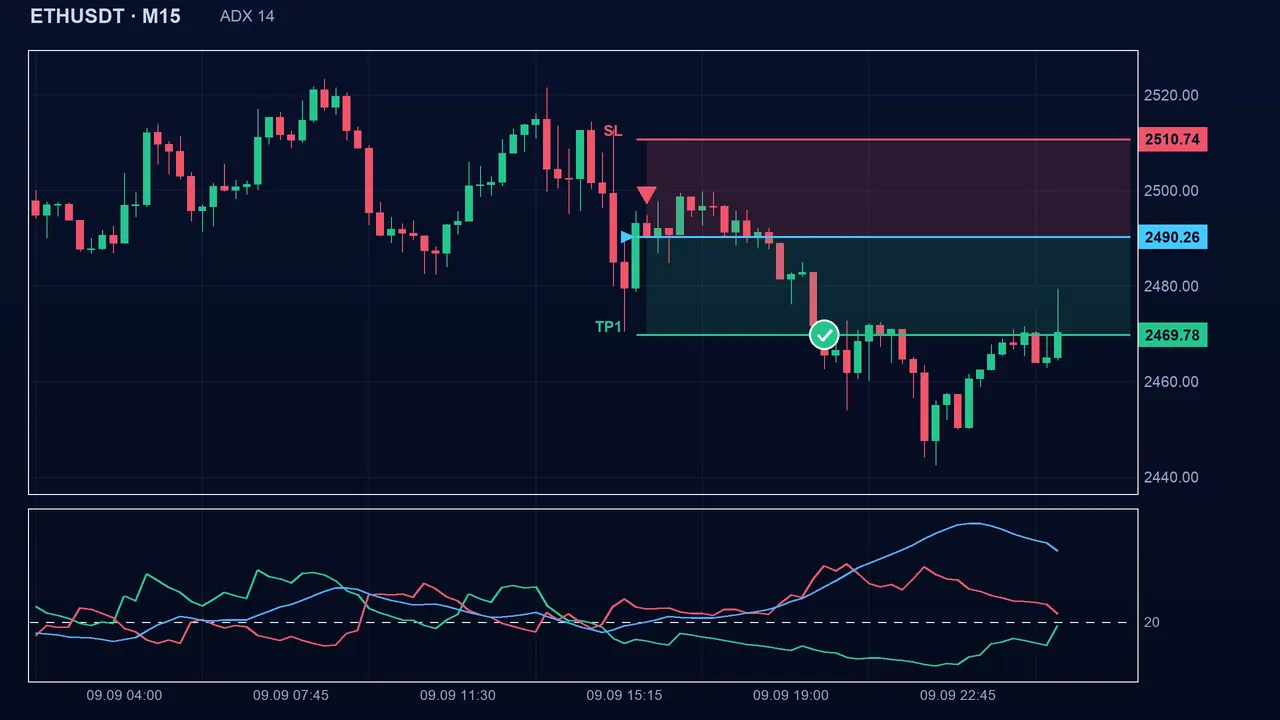
If the ADX is below the threshold (20 by default), the state is neutral: the market is judged to have no strong enough trend. If the ADX reaches or exceeds the threshold, the state follows the direction: bullish when +DI is above −DI, bearish otherwise. The buy or sell signal appears when the state flips, for example when the ADX crosses 20 while +DI dominates.
The settings
- Period: 14 by default (2 to 100). Shorter: the ADX reacts faster but fluctuates more. Longer: smoother but later, and the warm-up phase (2 times the period) gets longer.
- Minimum ADX: 20 by default (5 to 60). Lower: more signals, including false ones in soft markets. Higher: only very pronounced trends are accepted, but the signal comes later.
- Many traders use 20 to 25 as the mark of a “trend”, but these thresholds are a convention, not a law.
The pitfalls
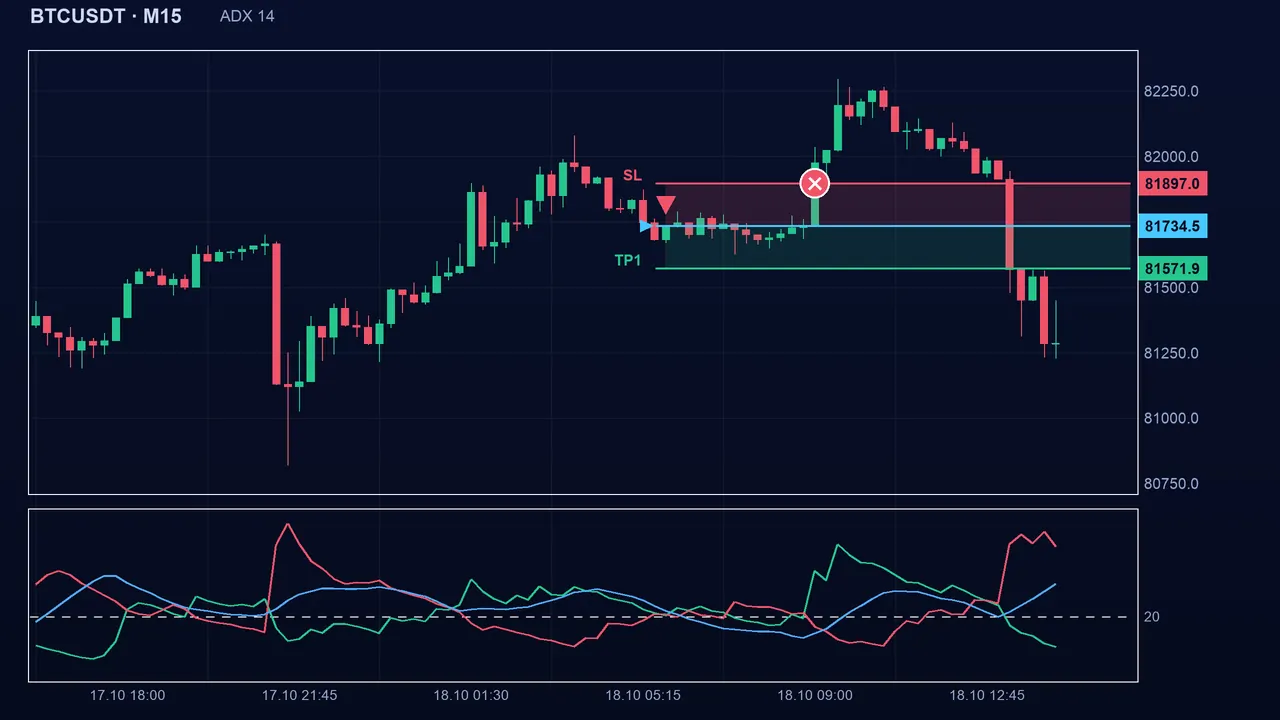
The ADX measures a strength that has already happened: it is smoothed, so it rises after the move has begun and stays high when the trend runs out of steam. A reading of 40 does not say the rise will continue; it says it has already been strong. Another pitfall: just above the threshold, +DI and −DI are often very close, and the direction can flip from one candle to the next. On Boom/Crash indices, a spike suddenly inflates the true range and can distort these values for several candles.
Key takeaways
- The ADX measures the strength of the trend, not its direction; direction comes from +DI and −DI.
- In Algo Signals: neutral if the ADX is below the threshold (20), otherwise bullish if +DI > −DI, bearish if not.
- It is slow: 28 candles of warm-up and a signal that is often late; a high reading does not predict what comes next.
- Default settings: period 14, minimum ADX 20.
📝 Lesson test
Log in to take this lesson’s test. Once you have passed all the tests, you will receive a certificate in your name.
Log inThese lessons are for understanding and are not investment advice. No method guarantees winning.