
A volatility channel draws a “normal” zone for price around an average. The Keltner Channel builds it with the ATR, the average size of candles. When price closes outside the channel, the move is stronger than usual. In Algo Signals, Keltner is read as a trend-following breakout signal, unlike Bollinger Bands.
How it is calculated
The centre line is a 20-candle exponential average of closes. The ATR is the simple average of the true range over the last 10 candles: for each candle, the largest of high − low, |high − previous close| and |low − previous close|. The upper band is the centre line + 2 × ATR, the lower band the centre line − 2 × ATR.
- Default values: average period 20 (period), ATR period 10 (atrPeriod), multiplier 2 (mult).
- The channel widens when candles grow and narrows when they shrink.
- Unlike Bollinger, the envelope is based on candle range and not on the standard deviation of closes.
Reading the signal in Algo Signals
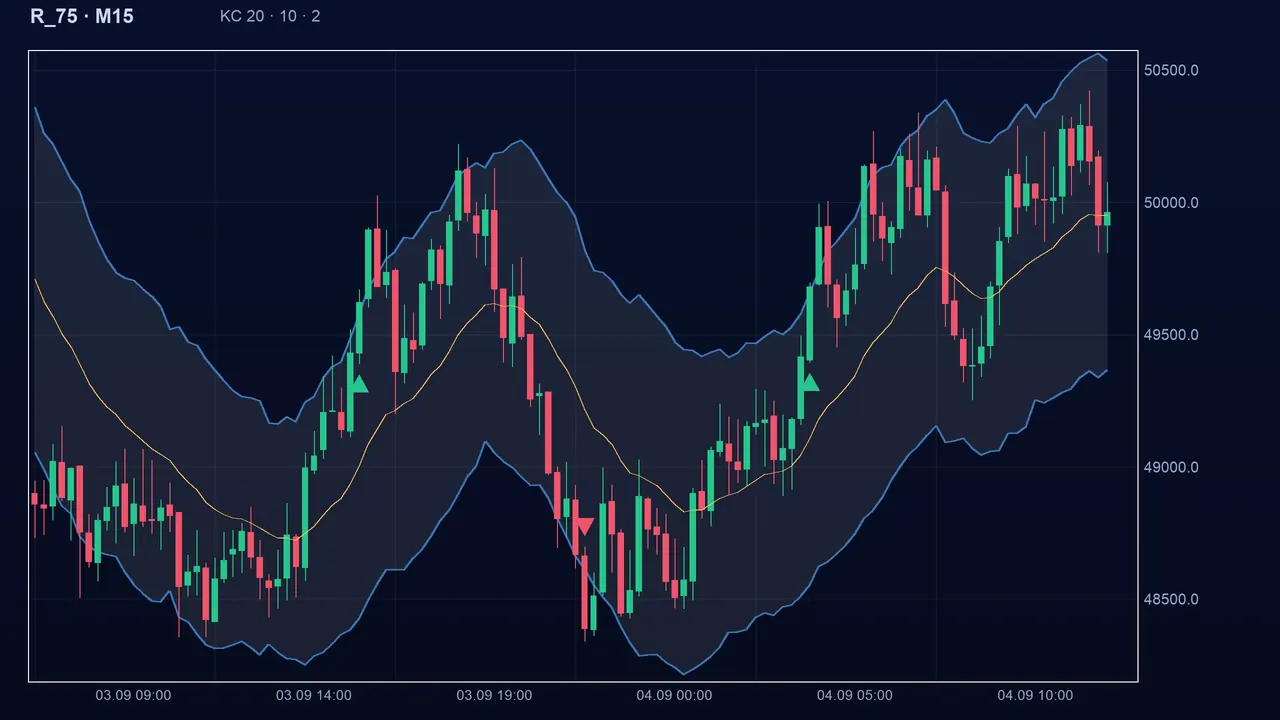
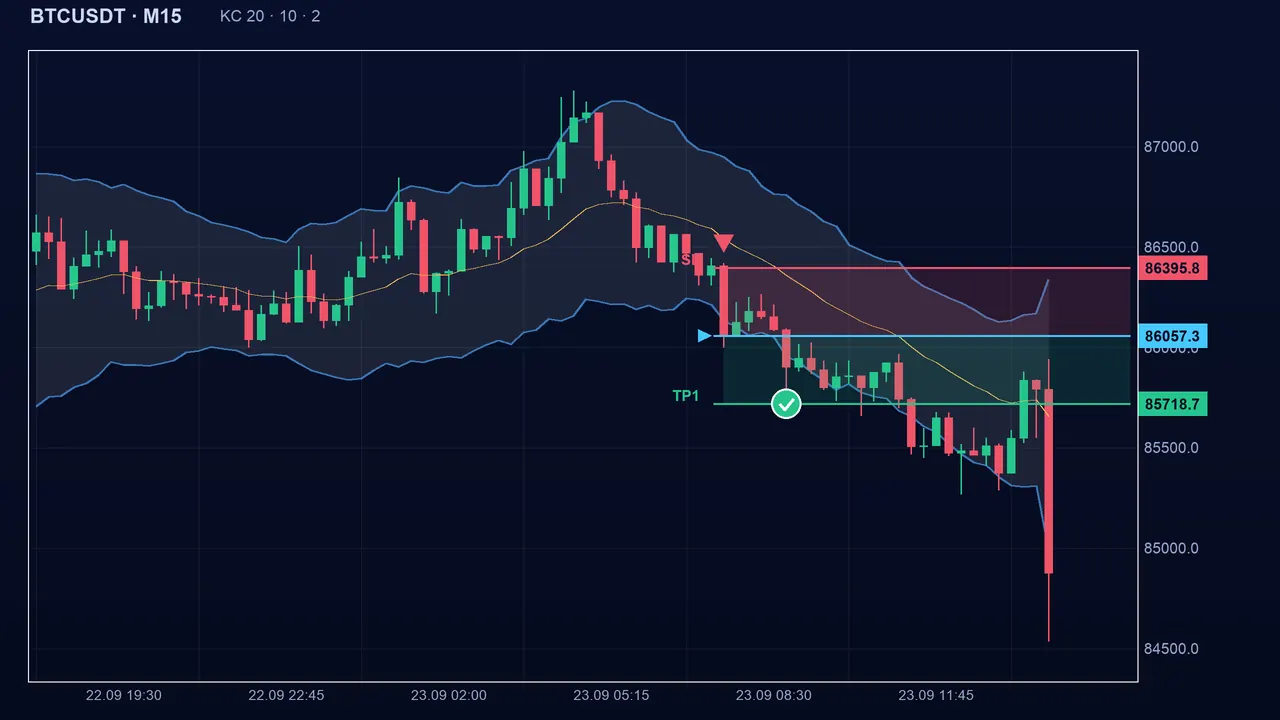
The state turns bullish when the close exceeds the upper band, bearish when it goes below the lower band. It holds as long as price stays on the right side of the centre line. The bullish state ends (back to neutral) when the close falls back below the centre line; the bearish state, when it rises back above it. If the close crosses the whole channel at once, the state flips directly.
The settings
- Average period (period, 20): shorter, the centre line follows price closely and the state ends sooner; longer, it is steadier.
- ATR period (atrPeriod, 10): shorter, the channel reacts fast to big candles; longer, it is more regular.
- Multiplier (mult, 2): at 3, the channel is wider and breakouts rarer but clearer; at 1, they are very frequent.
The pitfalls
Key takeaways
- Keltner = 20-period exponential average ± 2 × ATR(10).
- Buy: close above the upper band; sell: below the lower band; ends at the centre line.
- Breakout logic: the opposite of Bollinger, which bets on a return to the average.
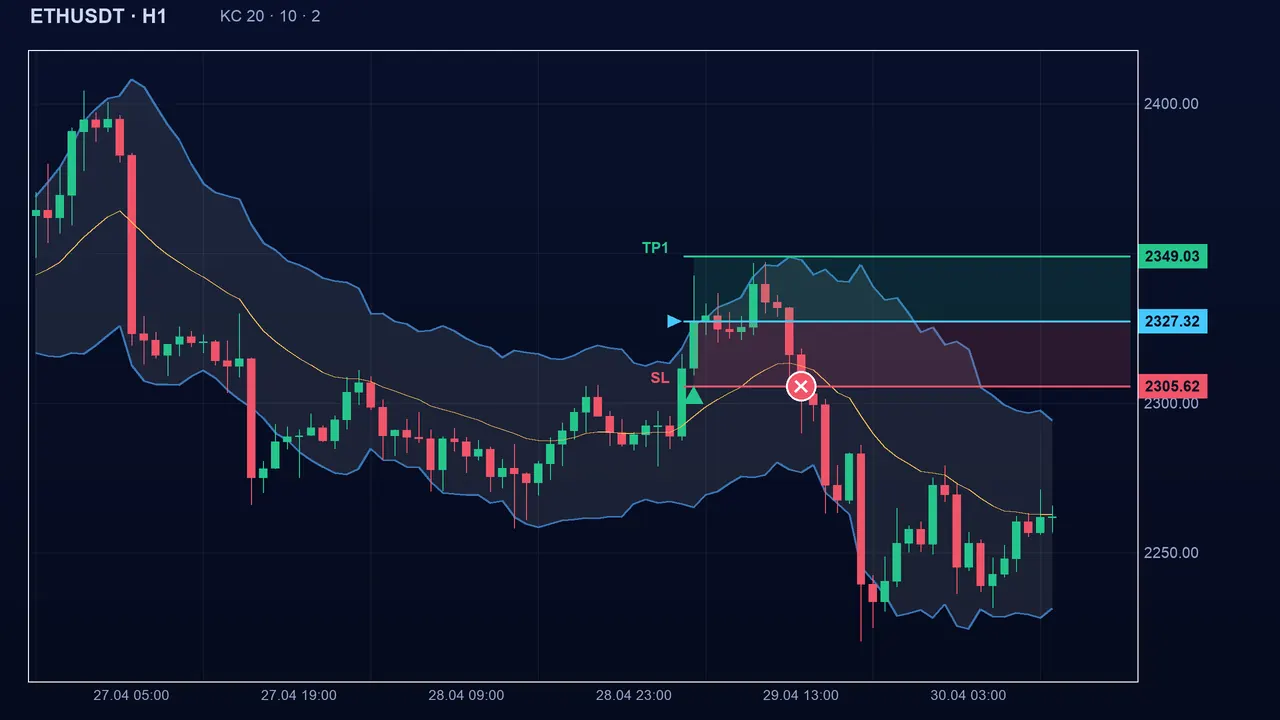
- False breakouts are frequent: define the stop before entering.
📝 Lesson test
Log in to take this lesson’s test. Once you have passed all the tests, you will receive a certificate in your name.
Log inThese lessons are for understanding and are not investment advice. No method guarantees winning.