
What are premium and discount zones for?
Buying in the middle of a range or at the very top does not carry the same risk. The idea behind premium / discount zones is simple: draw the recent range of price, cut it in two, and treat the upper half as “expensive” (premium) and the lower half as “cheap” (discount). It is a way of asking: is price rather high or rather low compared with what it has just done?
How it is calculated
On every candle, Algo Signals looks at the last N candles, including this one (N = 50 by default). It takes the highest high (HH) and lowest low (LL), computes the range (HH − LL) and the equilibrium, i.e. the midpoint: (HH + LL) / 2. It adds a neutral margin around the equilibrium equal to “margin × range” (0.05 by default). Until there are N candles, or if the range is zero, the state stays neutral.
- Close below (equilibrium − margin × range): discount, bullish state (buy zone).
- Close above (equilibrium + margin × range): premium, bearish state (sell zone).
- In between: neutral.
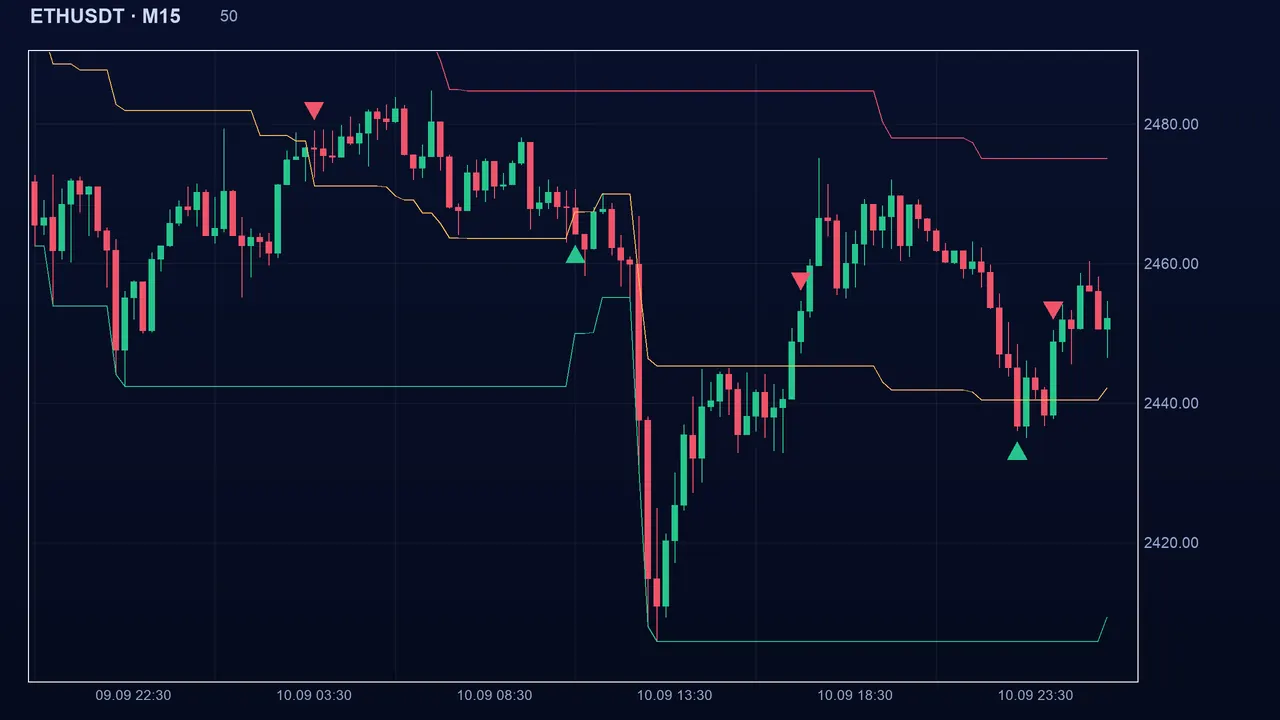
How to read the signal in Algo Signals
The state is that of each candle’s close, not a one-off event: price is in a zone or it is not. The buy or sell signal appears when the state flips (neutral to discount, for example). Like any state, it combines with other indicators: a buy zone that coincides with an order block or a support says more than a zone alone.
The settings
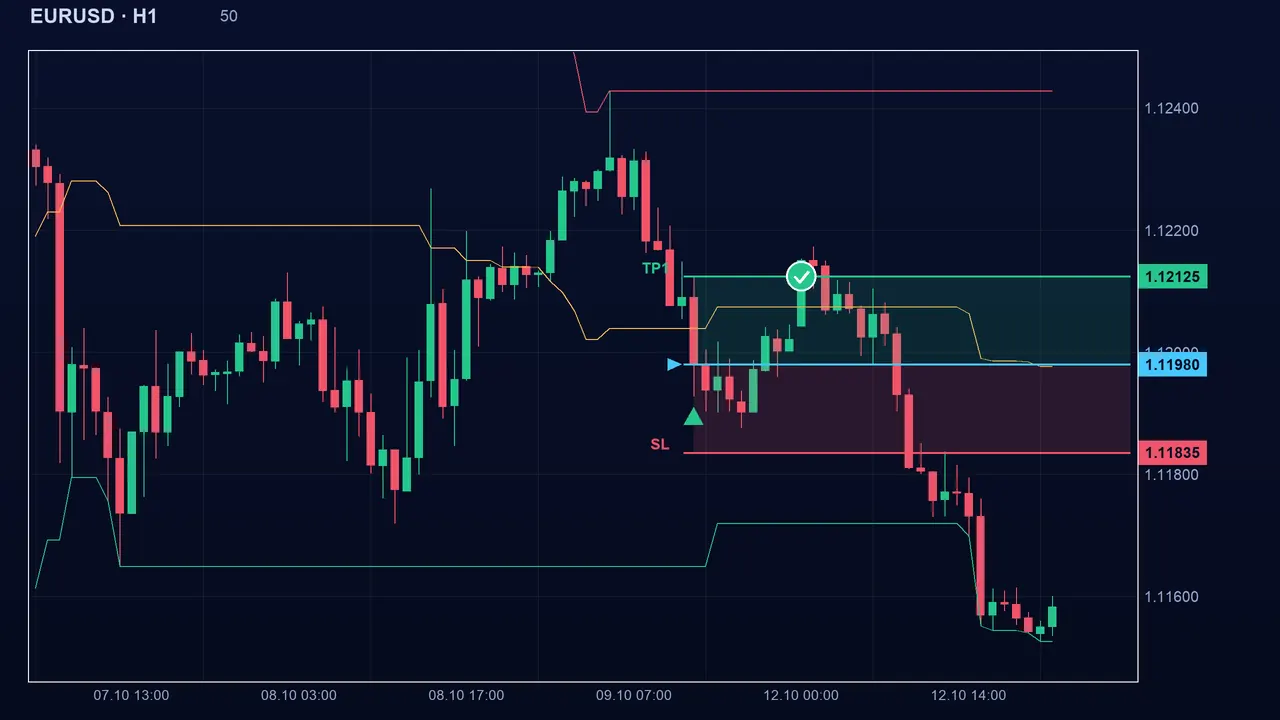
- Number of candles analysed (lbk, default 50, from 5 to 500): smaller, the range is recent and the state changes quickly; larger, the range is wide and the state changes slowly.
- Margin around the equilibrium (band, default 0.05, from 0 to 0.45): at 0, almost every close is premium or discount; at 0.45, price must be very close to the extremes to trigger. With 0.10 on the example, the neutral zone would run from 2,340 to 2,360.
The pitfalls
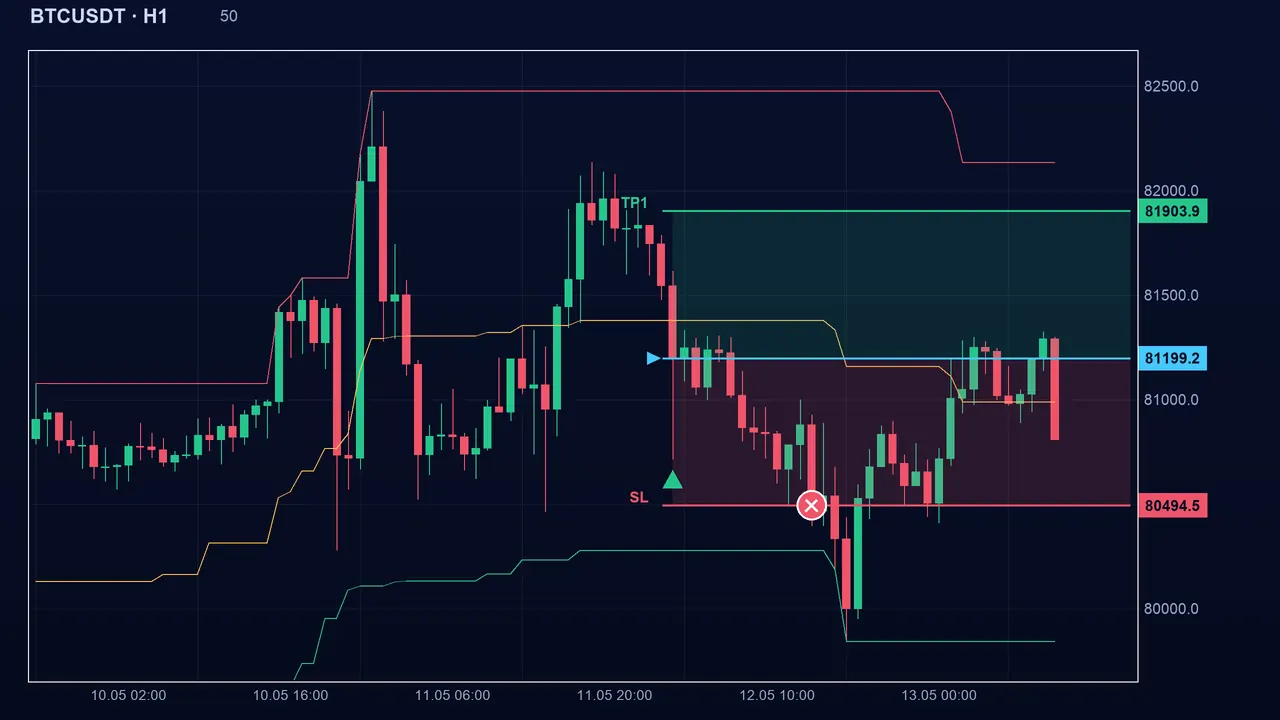
“Cheap” does not mean “will bounce”. In a downtrend, price spends most of its time in discount while it keeps falling, and the opposite in an uptrend. The indicator measures only a position within the range, never a direction.
Key takeaways
- Equilibrium = (highest high + lowest low) / 2 over N candles; discount below equilibrium minus the margin, premium above equilibrium plus the margin.
- It is a position state, not a forecast: discount ≠ guaranteed bounce.
- Filter with the trend: buying in discount within an uptrend makes more sense than in a crash.
- Combine it with a structure zone (order block, FVG, support) and always keep a stop.
📝 Lesson test
Log in to take this lesson’s test. Once you have passed all the tests, you will receive a certificate in your name.
Log inThese lessons are for understanding and are not investment advice. No method guarantees winning.