
What it is for
After a very quiet period, price often moves off more strongly: energy “compresses” then releases. The squeeze looks for exactly that: a tight market followed by a close outside the Bollinger Bands. It does not guess the direction in advance; it waits for price to show it.
How it is calculated
Algo Signals computes Bollinger Bands: an average over 20 candles and one band on each side at 2 standard deviations. The relative band width is 2 × 2.0 × standard deviation ÷ average. The smaller it is, the tighter the market.
It then compares the previous candle’s width with those of the last 100 candles. If it is among the lowest 20% (setting “share of the lowest widths”: 0.2), there is compression. If the current candle then closes above the upper band: buy signal. Below the lower band: sell signal.
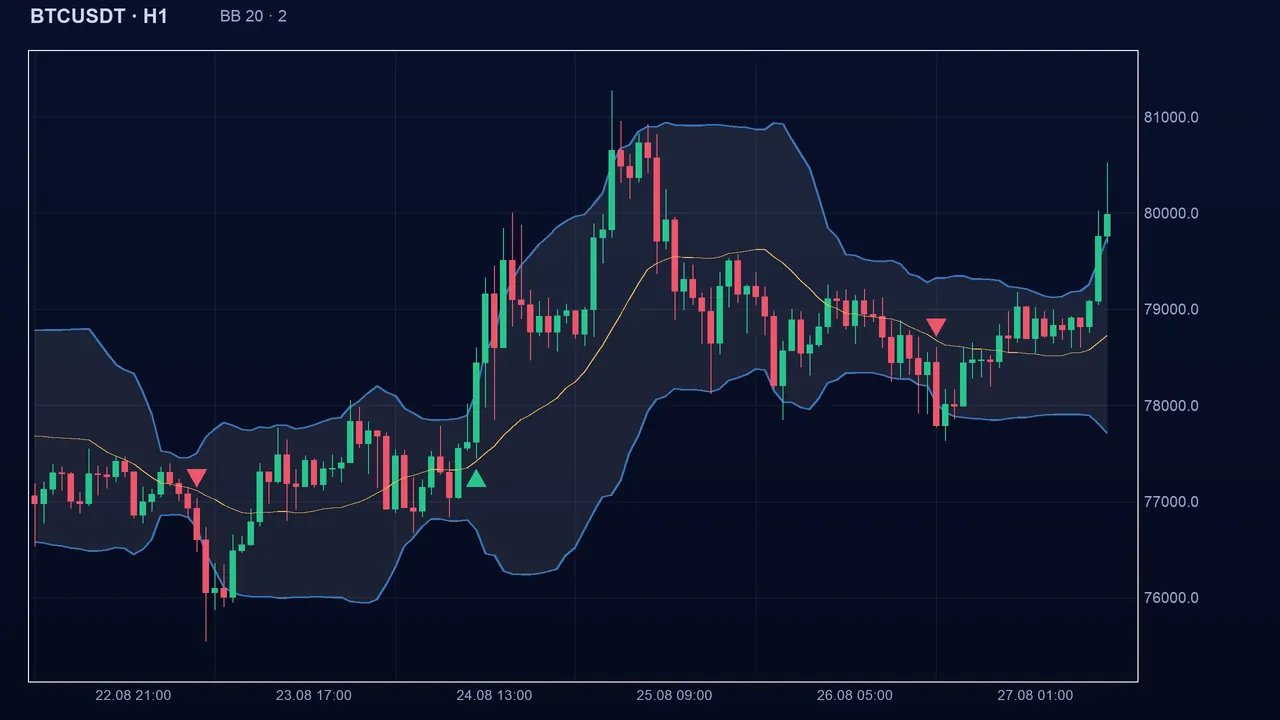
Reading the signal in Algo Signals
The signal lasts one candle only: the breakout candle. At least 120 candles of history (100 + 20) are needed for the indicator to start. The width is read on the previous candle: the compression must exist before the breakout, not be caused by it.
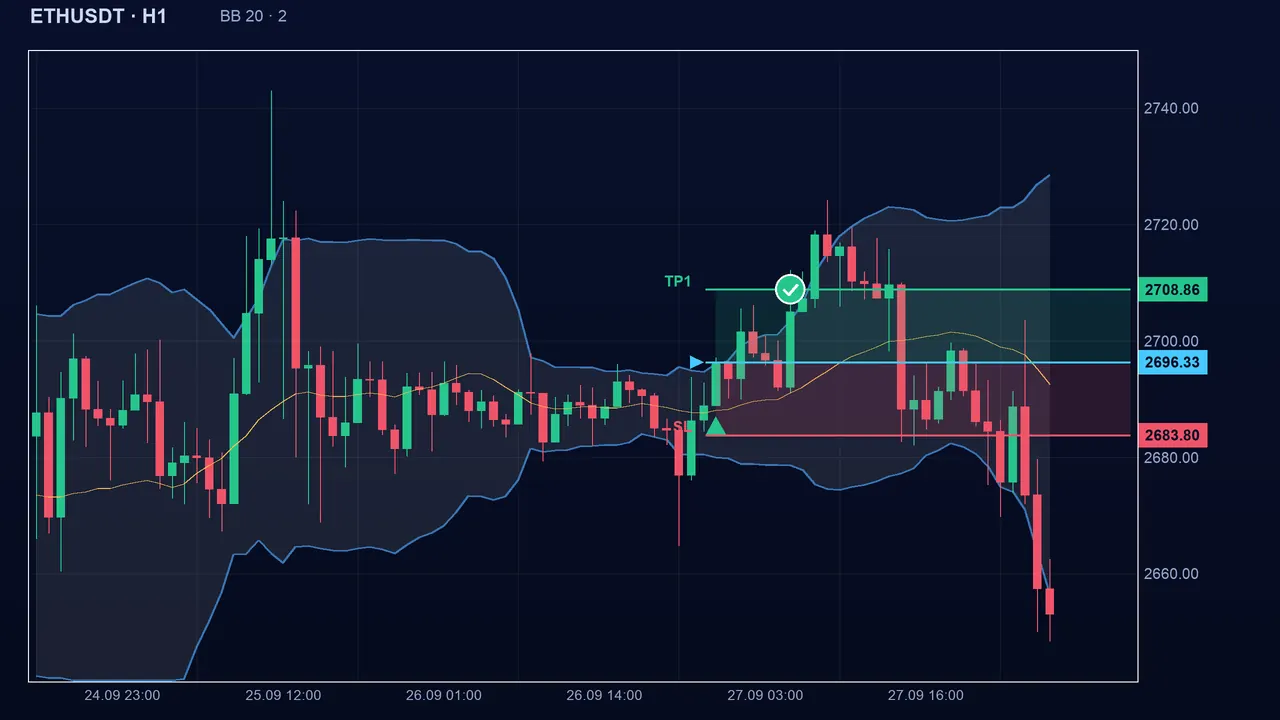
The settings
- Period: 20 by default (3 to 200). Band width: 2.0 standard deviations (0.5 to 5).
- Analysed history: 100 candles (20 to 500). Share of the lowest widths: 0.2 (0.02 to 0.6).
- A smaller share (0.1): stricter compression, fewer signals. A larger one (0.4): more signals, including weak compressions.
- Narrower bands (1.5 standard deviations) are crossed more easily: more signals, more false ones.
The pitfalls
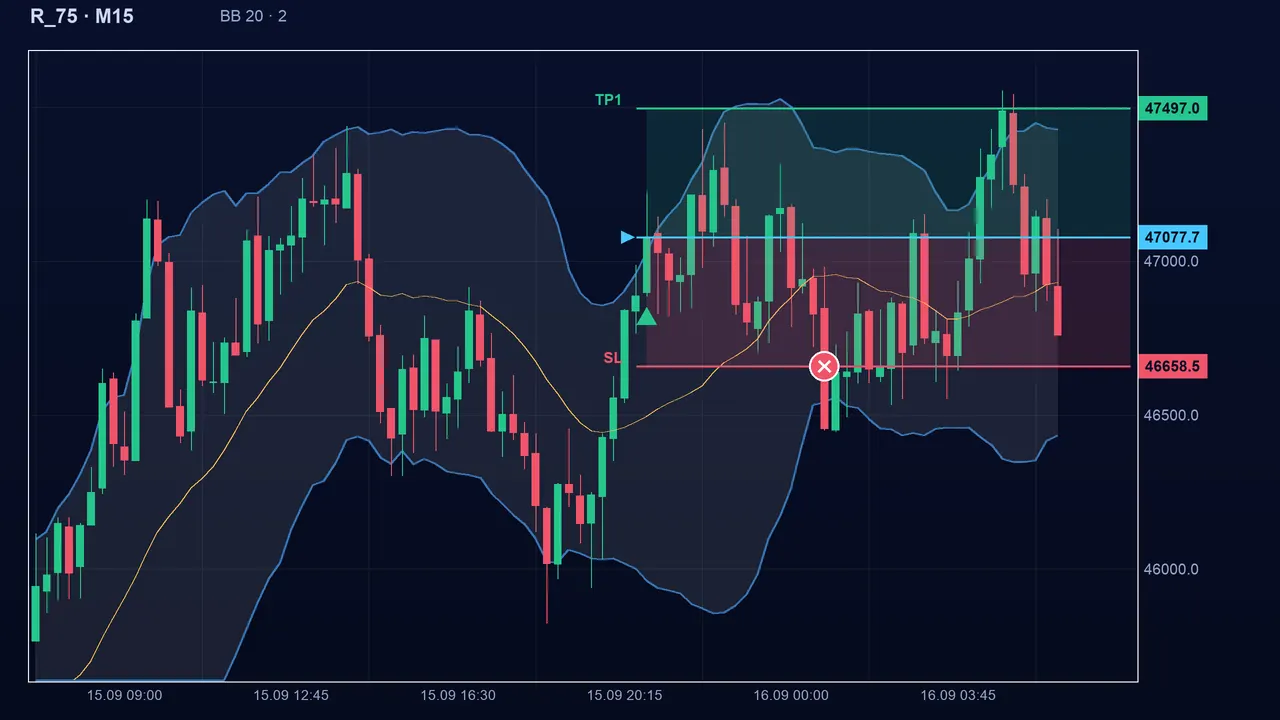
Compression announces a move, not its direction. Price can leave on one side, then go the other way. And leaving the band is not always the start of a trend: it can be a single impulse followed by a return inside the band.
Key takeaways
- The squeeze combines two conditions: a tight market (width among the lowest 20%), then a close outside the band.
- It announces a possible exit, not its direction or duration.
- The signal lasts one candle and needs at least 120 candles of history.
- In confluence: check the direction with a trend indicator (MA 200, ADX) and always protect the position.
📝 Lesson test
Log in to take this lesson’s test. Once you have passed all the tests, you will receive a certificate in your name.
Log inThese lessons are for understanding and are not investment advice. No method guarantees winning.