
When the price rises, closes tend to land near the recent high; when it falls, near the recent low. The stochastic measures exactly that: how high, between the lowest low and the highest high of the last candles, the latest close sits. It lives between 0 and 100 and is used to spot a possible exhaustion or reversal, never to guarantee one.
How it is calculated
For each candle, Algo Signals looks at the last 14 (the kPeriod setting). The raw %K equals (close − lowest low) ÷ (highest high − lowest low) × 100. Close at the high: 100; at the low: 0; if the range is zero: 50. This raw %K is then smoothed with a simple average of 3 values (smooth): that is the %K line. Finally a second simple average of 3 values (dPeriod) gives the slower %D line.
- Raw %K: position of the close within the range of the last 14 candles.
- %K = average of 3 raw %K. %D = average of 3 %K.
- The first candles (about 20) lack history: the state stays neutral.
Reading the signal in Algo Signals
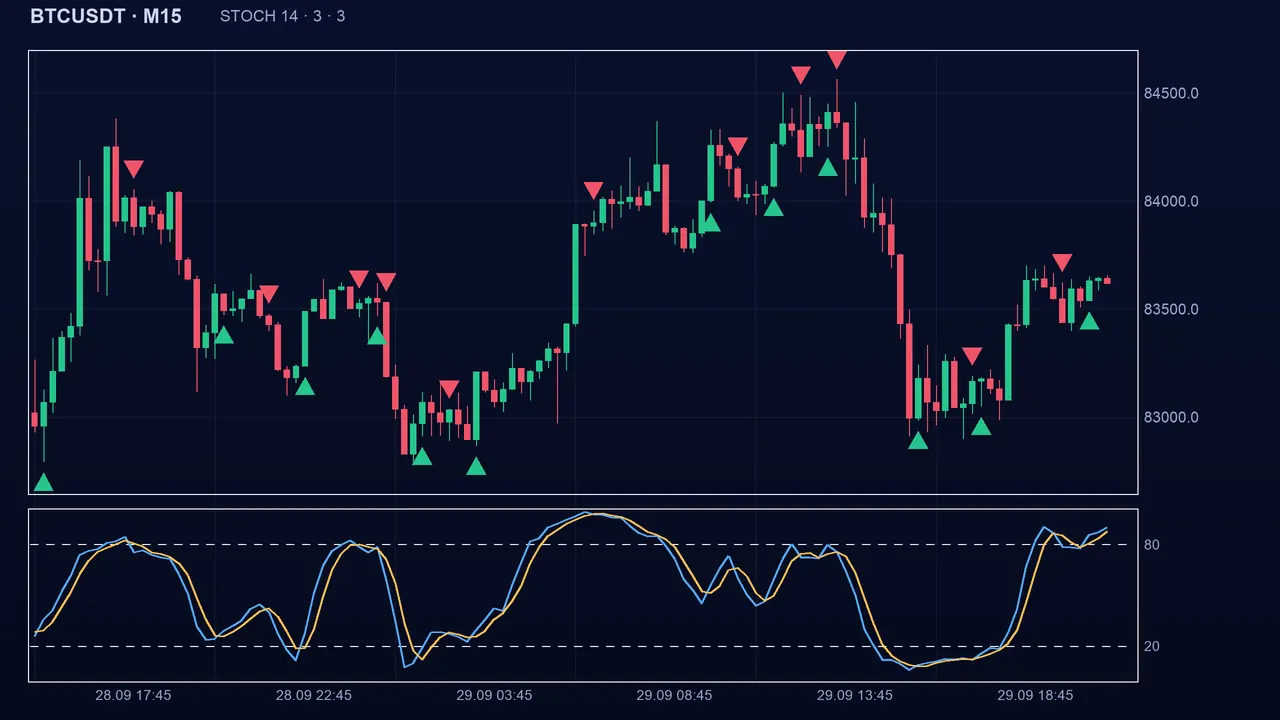
The state is bullish when %K is above %D and bearish when it is below. A buy signal appears when %K crosses above %D, a sell signal when it crosses below. Note: Algo Signals does not require an extreme zone. The usual landmarks (below 20 = oversold, above 80 = overbought) are a reading you can add yourself, not a condition in the code.
The settings
- K period (kPeriod): 14 by default (1 to 100). Shorter, the indicator is jumpy; longer, calmer.
- Smoothing (smooth): 3 by default (1 to 50). Larger, less noise but a later signal.
- D period (dPeriod): 3 by default (1 to 50). Larger, the %D line is slower and crossovers are rarer.
- These values are conventions. Tuning them to “fit” the past produces settings that do not repeat.
The pitfalls
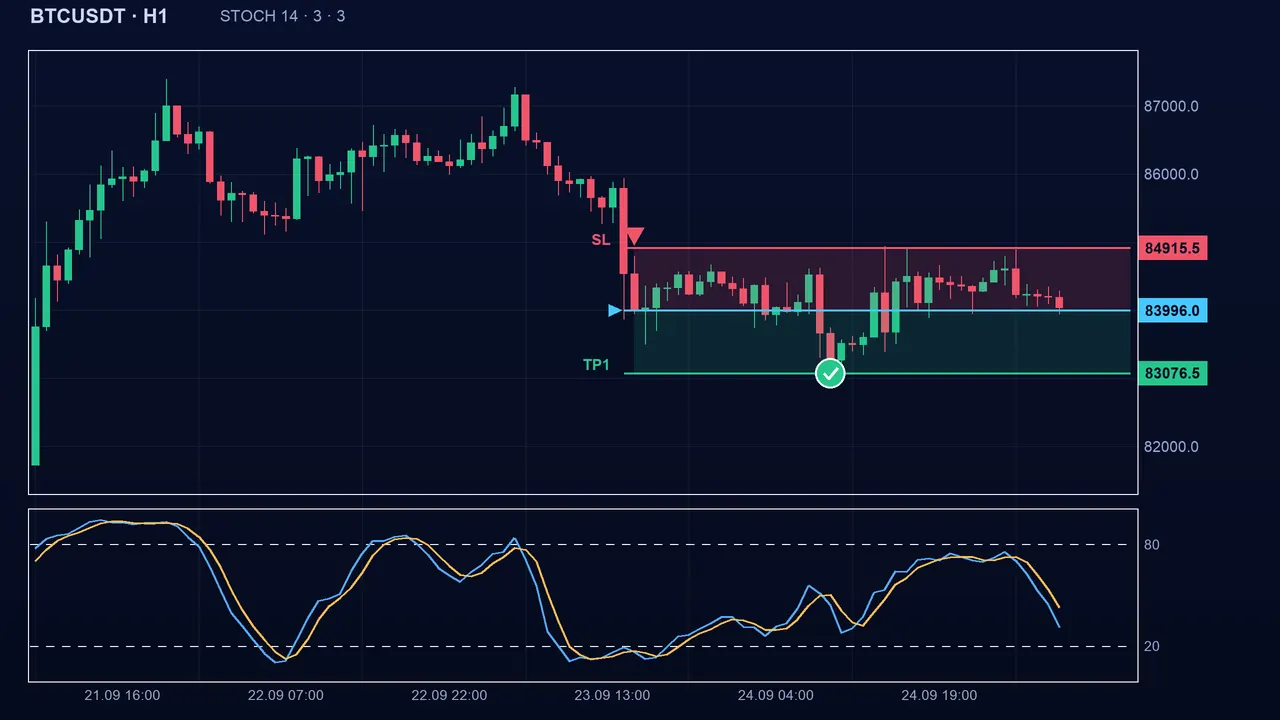
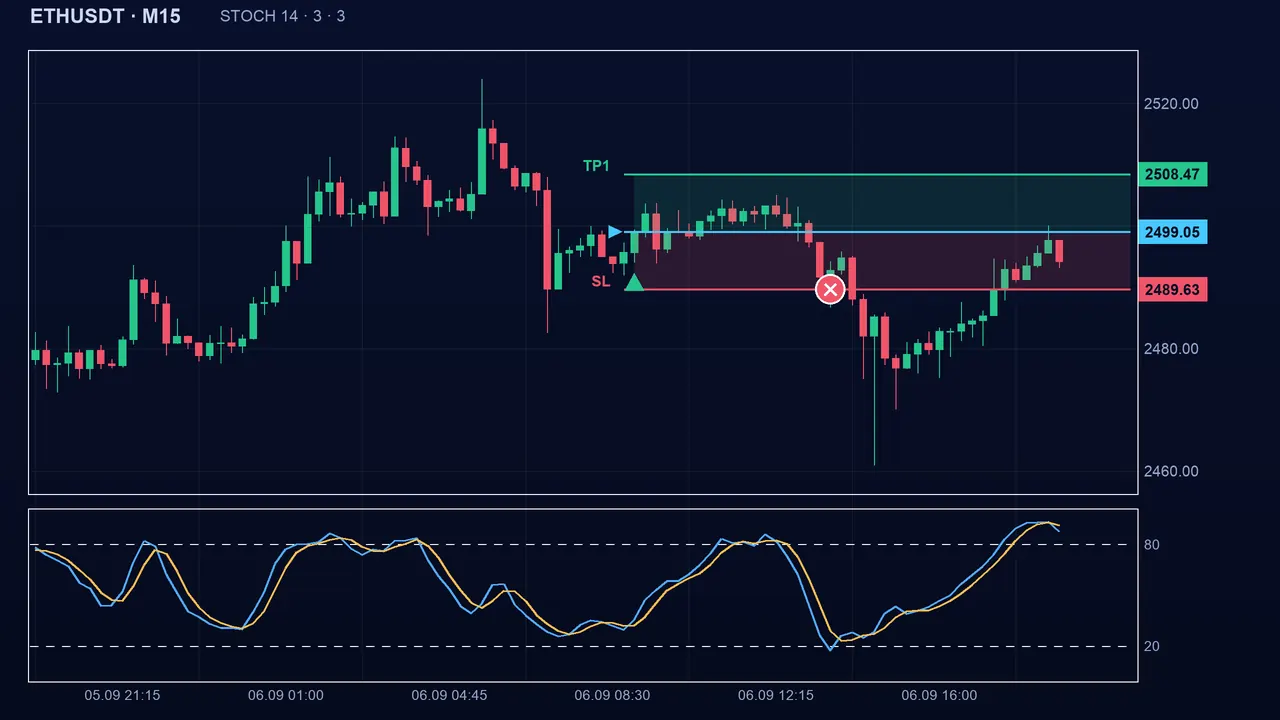
In a strong uptrend the stochastic can stay near 100 for a long time: each small dip makes %K cross below %D and produces a sell while the price keeps rising. That is the classic mistake: taking “high” for “will fall”. The crossover is also sensitive, hence noisy in an agitated market, and on spike indices (Boom/Crash) a sudden spike can distort it.
Key takeaways
- Stochastic = position of the close within the range of the last 14 candles; buy when %K crosses above %D, sell when it crosses below.
- Algo Signals does not require a 20 / 80 zone: the crossover is enough.
- It is more useful in a trendless market, and dangerous against a strong trend.
- For better confluence, combine it with a trend indicator (MA 200, ADX): for example accept only buys when the trend is up.
📝 Lesson test
Log in to take this lesson’s test. Once you have passed all the tests, you will receive a certificate in your name.
Log inThese lessons are for understanding and are not investment advice. No method guarantees winning.