
Some traders start by choosing the reward-to-risk ratio they want, then place their levels accordingly. The fixed-ratio method does exactly that: you choose the stop in ATR and the two ratios, and the targets follow.
How the levels are calculated
The calculation is the same as the ATR method’s: only the setting values are separate (the fixed-ratio method has its own settings, distinct from the ATR method’s). The entry price is the close of the signal candle; the ATR is the 14-candle one (0.3% of the price if not yet available).
- Risk = slMult × ATR (1.5 × ATR by default).
- Stop: at the “risk” distance from entry, on the losing side.
- TP1 = entry + rr1 × risk (rr1 = 1 by default); TP2 = entry + rr2 × risk (rr2 = 2 by default), in the direction of the trade.
- No chart reading: no support, no band, no structure.
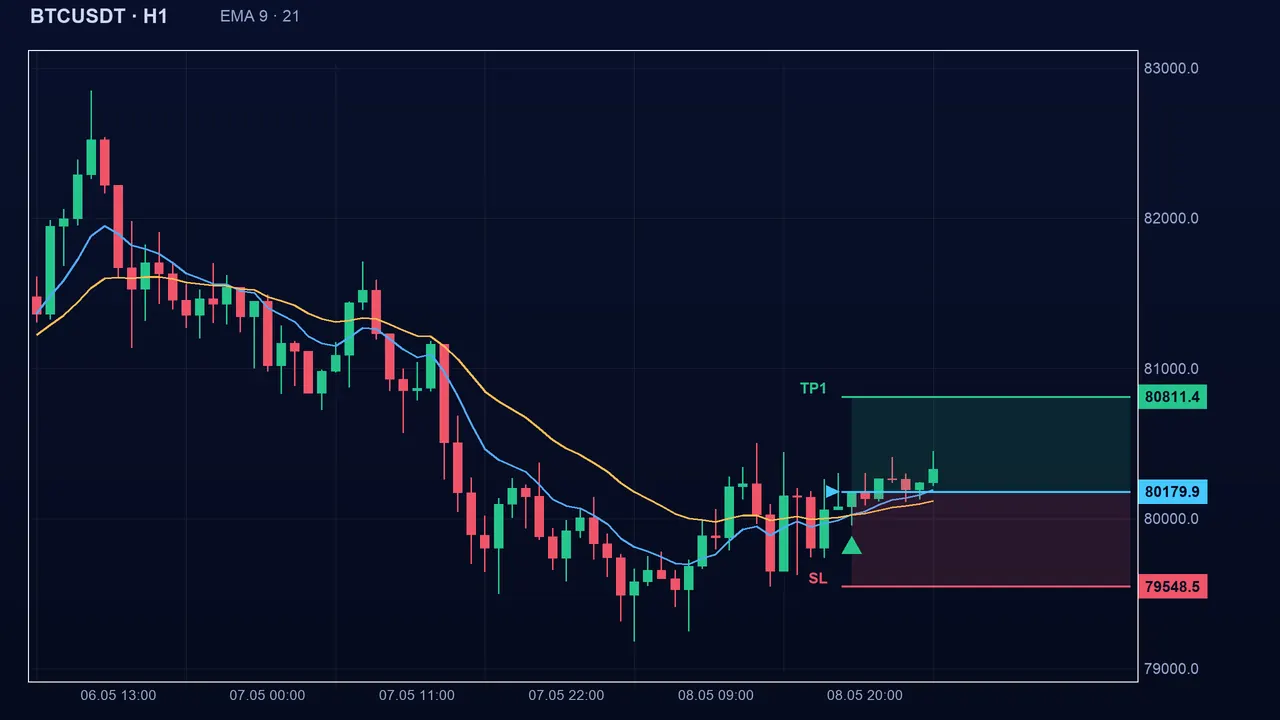
A worked case
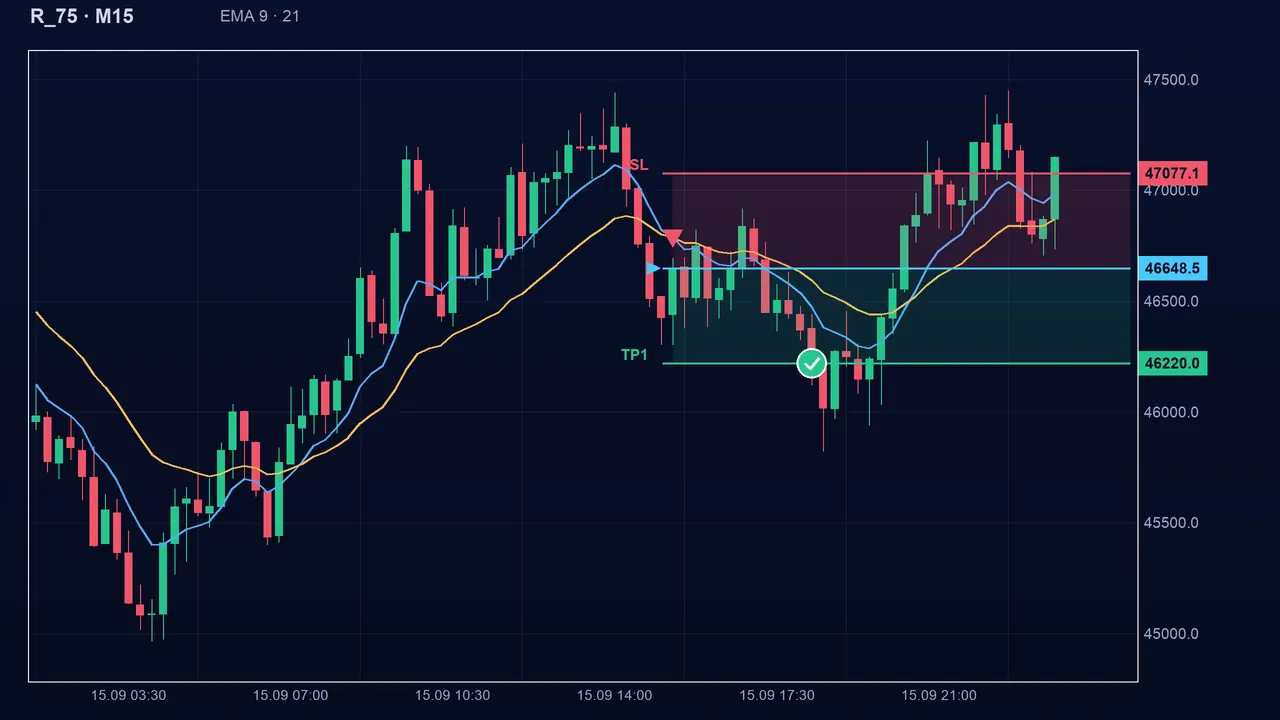
A 1:3 ratio breaks even with about 25% winning trades (1 divided by 1 + 3), before fees and spread; 1:1.5 needs 40%; 1:1 needs 50%. These thresholds are arithmetic, not a forecast of success.
Settings and safeguards
- Stop multiplier (slMult): 1.5 by default, from 0.1 to 10. Smaller, the stop is tight; larger, the loss per trade grows.
- TP1 ratio (rr1): 1 by default, from 0.2 to 10.
- TP2 ratio (rr2): 2 by default, from 0.4 to 20.
- Linked settings: if you keep rr1 and rr2 fixed and widen the stop, every level moves away proportionally.
Explicit-ratio method: your ratios are kept. Only the basic checks apply: stop on the losing side more than 0.1 ATR from entry (otherwise 1.5 ATR), TP1 on the right side, TP2 farther than TP1. The stop cap and the minimum ratios do not apply.
The pitfalls
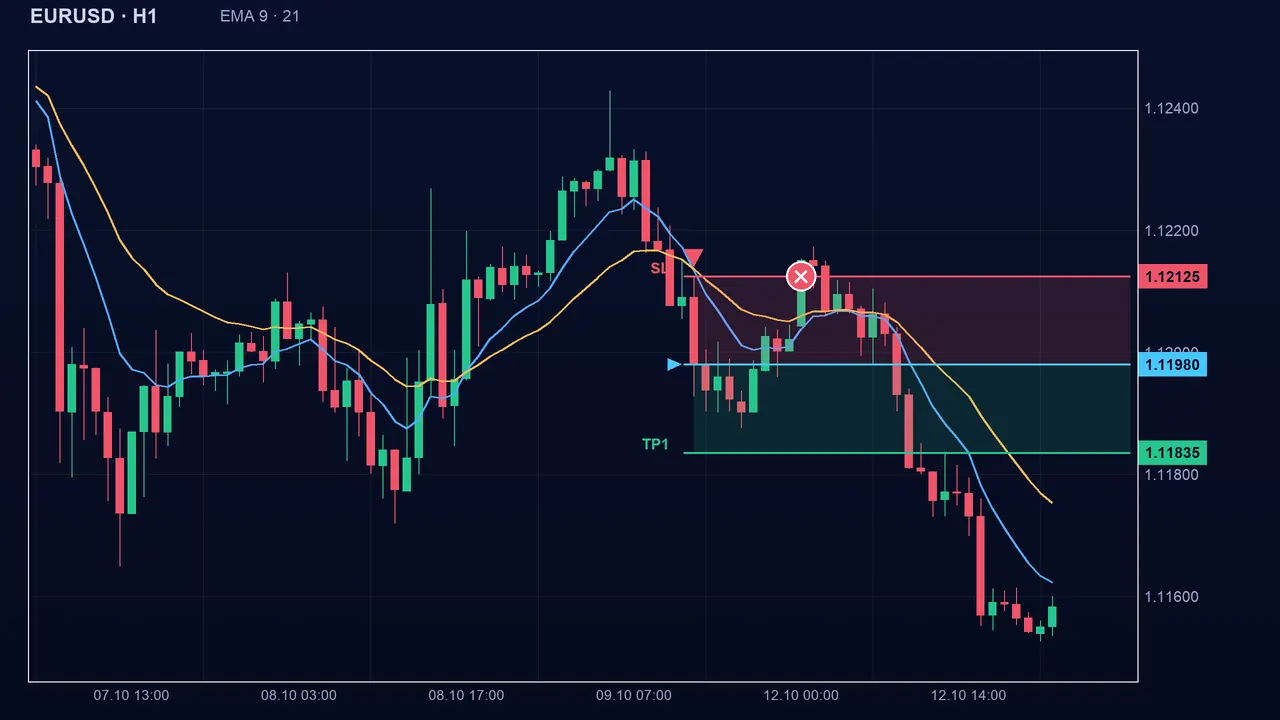
Choosing a ratio without looking at the market is arbitrary: a target at 3 times the risk may land beyond an obvious obstacle. And a high ratio says nothing about the probability of reaching it: the farther the target, the less often it is reached.
Key takeaways
- Stop = slMult × ATR; TP1 and TP2 = rr1 and rr2 times that risk.
- Same formulas as the ATR method, with separate settings.
- Break-even threshold: 1 divided by (1 + ratio); 25% at 1:3, 33% at 1:2, 50% at 1:1 (before fees).
- No chart reading: compare with level-based methods.
- Confluence: choose the stop according to the asset’s volatility, not only the ratio you want.
📝 Lesson test
Log in to take this lesson’s test. Once you have passed all the tests, you will receive a certificate in your name.
Log inThese lessons are for understanding and are not investment advice. No method guarantees winning.