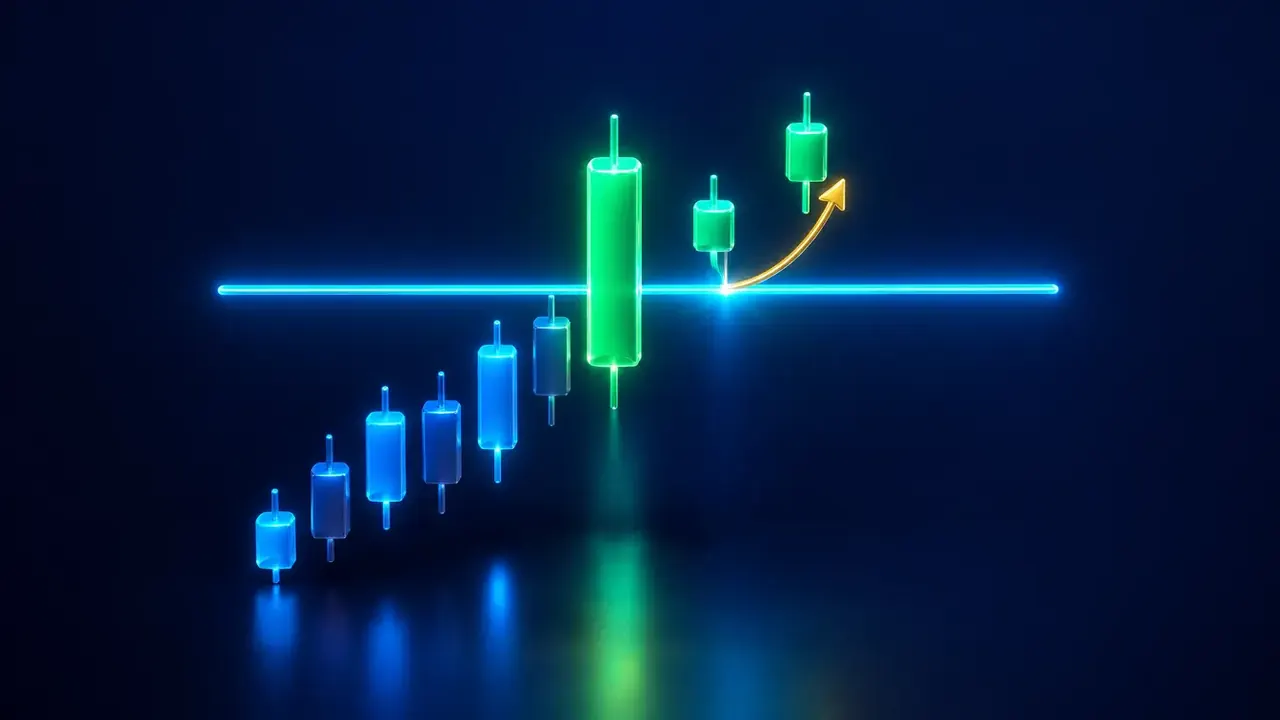
When price breaks a level, many traders hesitate to chase it: the move has already left. A common idea is to wait for price to come back and test the broken level, which then becomes a support or resistance. The Breakout then retest indicator automates that wait.
What it is for
It avoids buying in full acceleration. It waits for a first clean breakout, then a return to the level, and flags only if price bounces off that level. Entry is therefore closer to the level, with a shorter stop than buying the breakout.
How it is calculated
- Level: the highest high (for a bullish breakout) or lowest low (bearish) of the previous 24 candles.
- Breakout: a candle closes beyond the level AND its body (open to close) is at least 0.8 ATR(14). The broken level is stored.
- Retest: within the next 5 candles (the 1st to the 5th), a candle touches the level within 0.1 ATR, closes on the right side of the level and in the trade’s direction (buy: close above open), with either a lower wick more than half the body or a close above the previous candle’s high. The sell is the mirror.
- If no valid retest arrives within 5 candles, the level is forgotten. A new breakout replaces the old one.
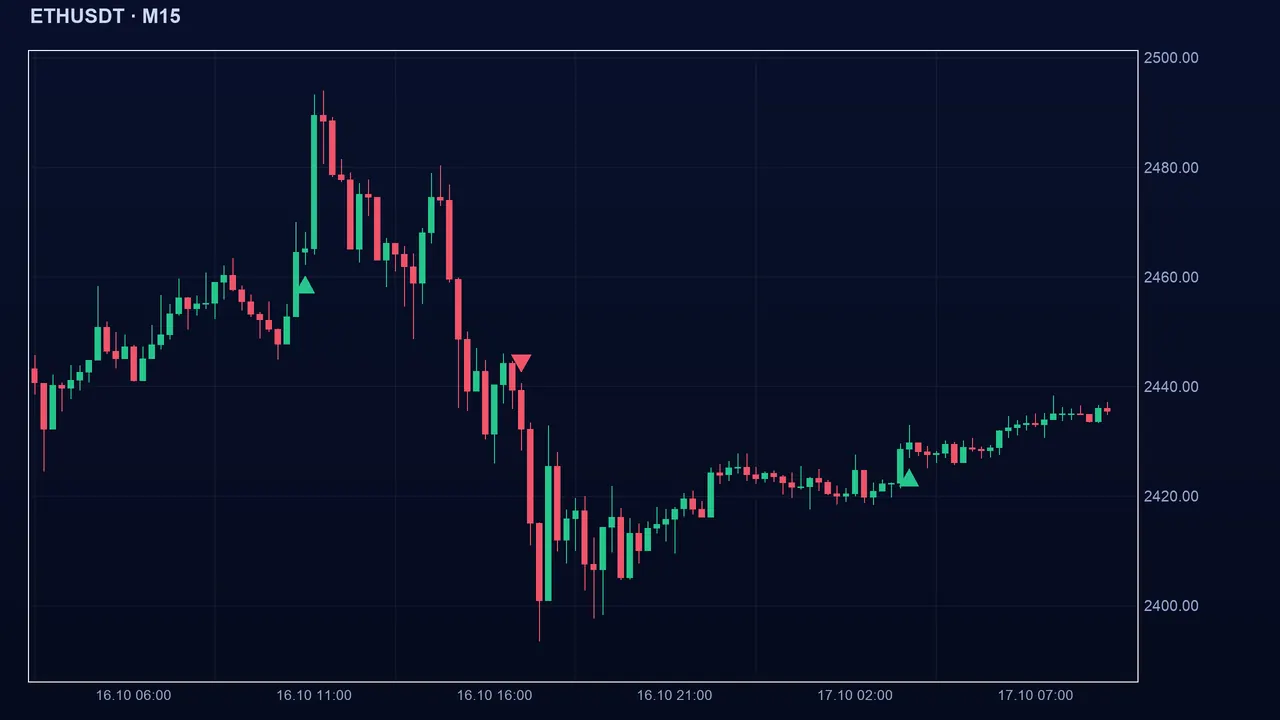
The indicator uses only prices: it works on Deriv as on Binance.
Reading the signal in Algo Signals
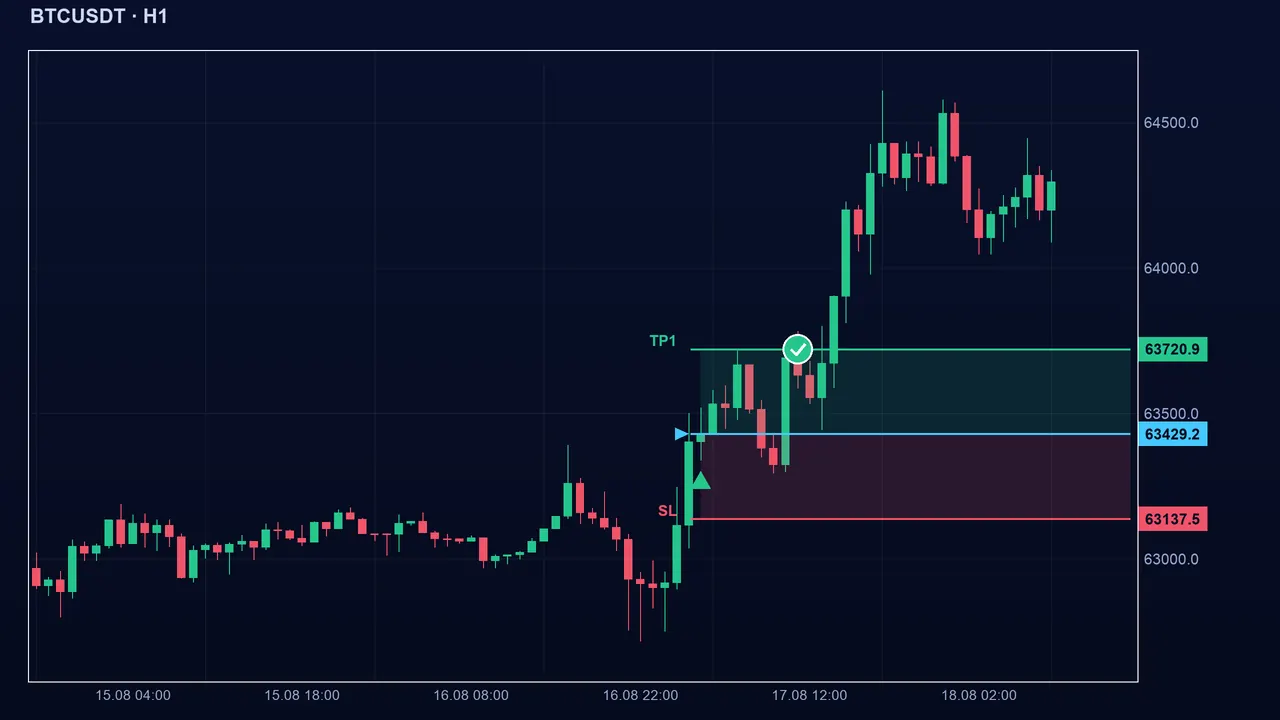
An arrow appears on the retest candle, not on the breakout. The signal is a one-off: once emitted, the level is erased, and no state is held.
Settings and pitfalls
- Lookback (24, from 5 to 300): the number of candles defining the level. The larger it is, the more important the broken level and the rarer the signals.
- Breakout in ATR (0.8, from 0.1 to 5): the minimum body size of the breakout. The larger it is, the cleaner the breakout must be.
- Retest candles (5, from 1 to 30): the time allowed for the retest. The longer it is, the later the returns accepted.
- Tolerance (0.1, from 0 to 2): in ATR, the maximum distance between the candle’s low and the level.
Key takeaways
- Breakout: a close beyond the previous 24 candles with a body of at least 0.8 ATR.
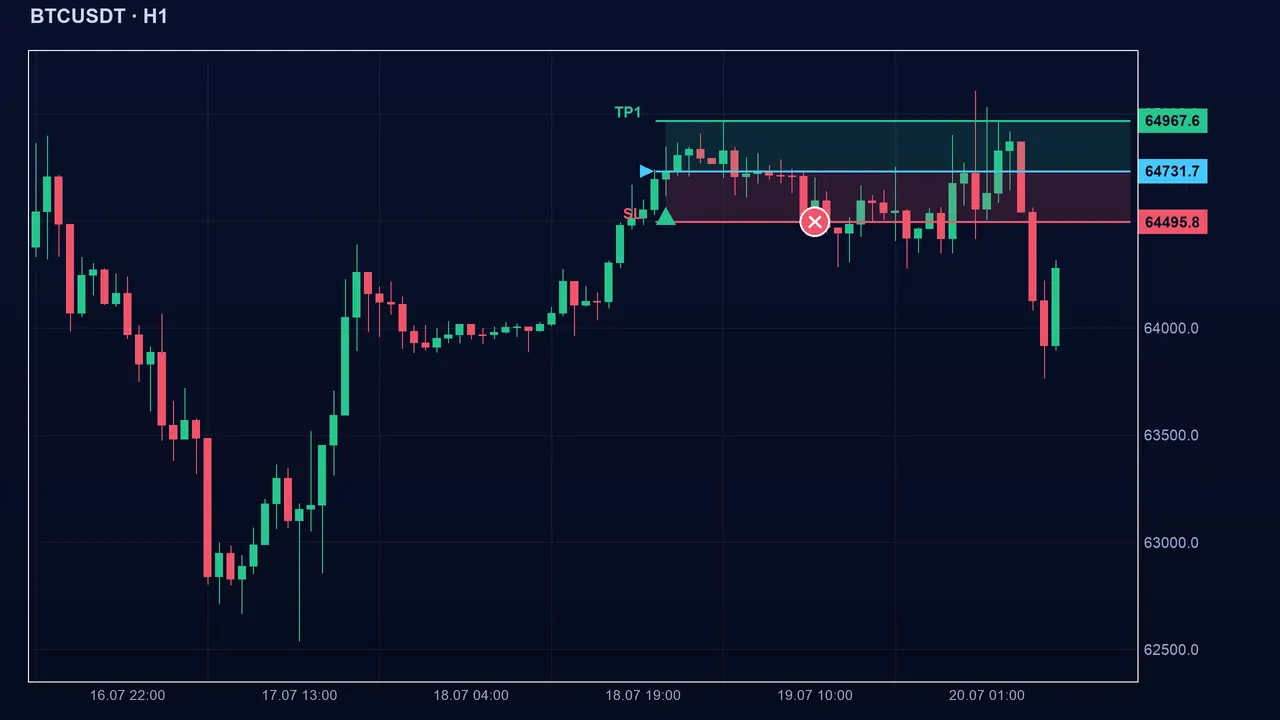
- Signal: a retest of the level within the next 5 candles, with rejection, a close on the right side and a candle in the right direction.
- The signal arrives on the retest candle; otherwise the level is forgotten.
- It uses only prices, on Deriv as on Binance.
📝 Lesson test
Log in to take this lesson’s test. Once you have passed all the tests, you will receive a certificate in your name.
Log inThese lessons are for understanding and are not investment advice. No method guarantees winning.