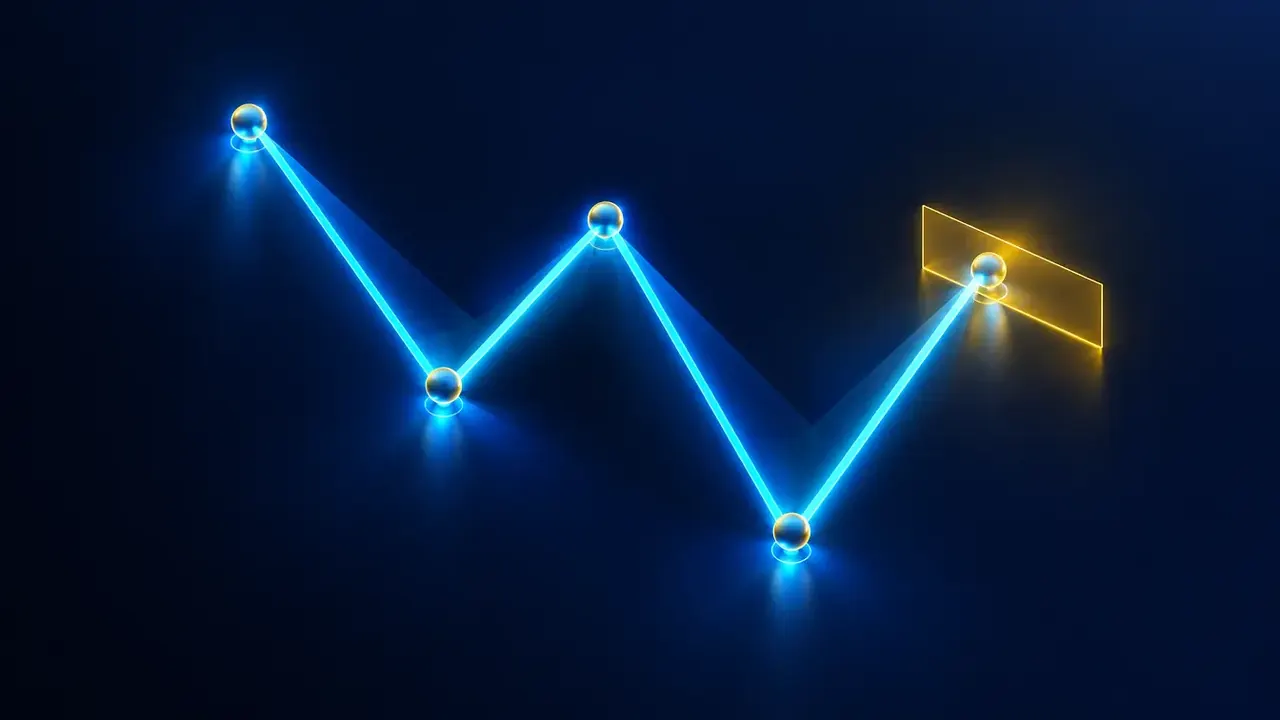
Harmonic patterns are shapes drawn by four or five turning points (X, A, B, C, D) whose distances follow precise ratios, often close to Fibonacci’s (0.382, 0.618, 0.786, 0.886…). The idea: when the ratios fit, you can anticipate the zone where price turns, point D. The Harmonic indicator does that work for you.
What it is for
It automatically tests several patterns on the latest confirmed highs and lows. When one fits, it computes the potential reversal zone (PRZ) and flags the moment price enters it.
How it is calculated
- Points: confirmed highs and lows (a point is confirmed 3 candles after it forms, with 3 candles on each side). The last 4 are kept, X, A, B, C, alternating high and low. At least 60 candles are needed.
- Ratios: B retraces a share of XA (ratio |AB| ÷ |XA|), C retraces a share of AB (|BC| ÷ |AB|). Each pattern imposes a range for B: Gartley 0.588 to 0.648; Bat 0.382 to 0.55; Butterfly 0.786; Crab 0.382 to 0.618. C must be between 0.382 and 0.886. A tolerance of 0.05 widens the ranges.
- D’s PRZ: computed two ways, a share of XA measured from A (Gartley: 0.786 to 0.886) and a projection of BC measured from C (Gartley: 1.0 to 1.618). The zone unites both, then widens by 6% of XA.
- Patterns: Gartley, Bat, Alternate Bat, Crab, Deep Crab, Butterfly, plus AB=CD, 5-0, Cypher, Shark and 3 Drives. The first that fits is kept.
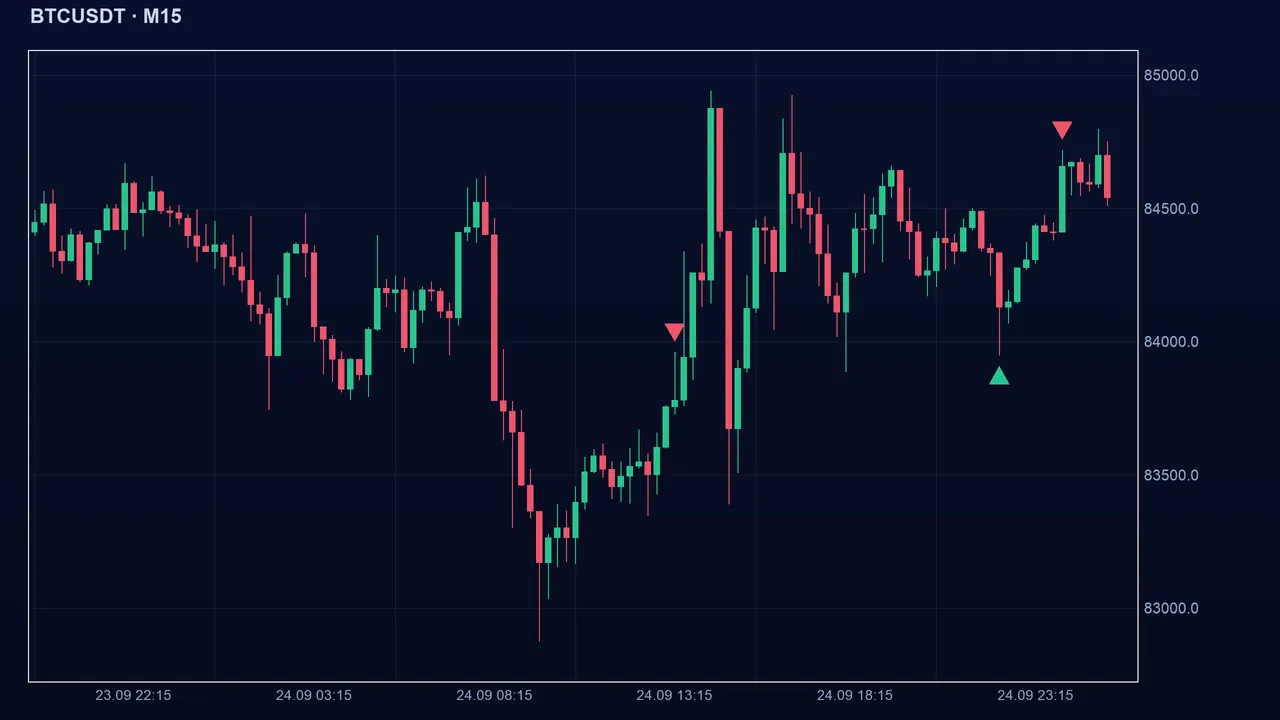
Direction: if X is a low, the pattern is bullish (D will be a low, we look for a buy); if X is a high, it is bearish.
Reading the signal in Algo Signals
The state is bullish (or bearish) as long as the close stays within the last found pattern’s PRZ, and neutral outside. Algo Signals flags the moment price enters the zone. So you act in a zone, not on an exact point. Also, each point is only known 3 candles after it forms: the pattern appears with that delay.
Settings and pitfalls
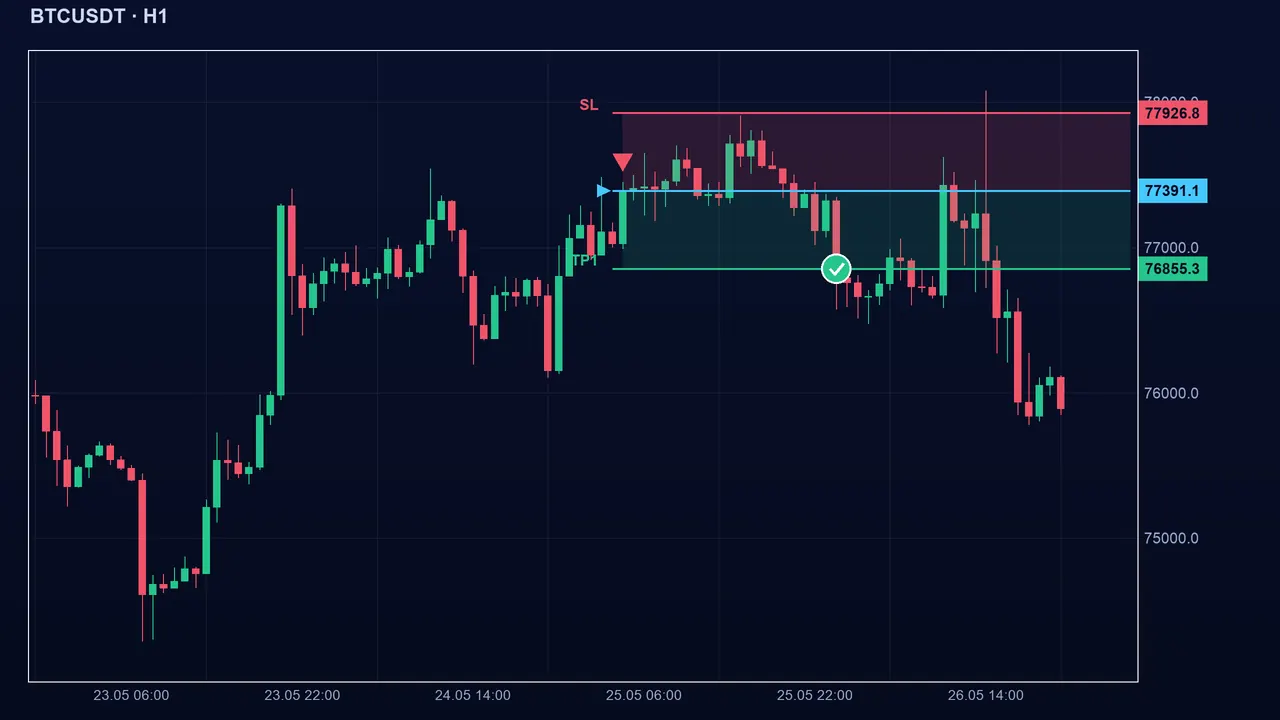
- Tolerance (tol, 0.05, from 0 to 0.5): the larger it is, the more ratios may stray from the ranges and the more patterns are found, including false ones.
- Zone margin (przPad, 0.06, from 0 to 0.5): the share of XA added around the PRZ. The larger it is, the wider the zone.
- Each pattern’s ratio ranges are fixed in the code. Those of Butterfly, 5-0, Shark and 3 Drives come from standard literature, not from a profitability test.
Key takeaways
- The indicator looks, on the latest confirmed highs and lows, for a pattern whose ratios (B over XA, C over AB) fall in precise ranges.
- It derives the PRZ, a zone, and flags the close entering it. Bullish if X is a low.
- Points are confirmed only 3 candles after they form: the signal arrives with a delay.
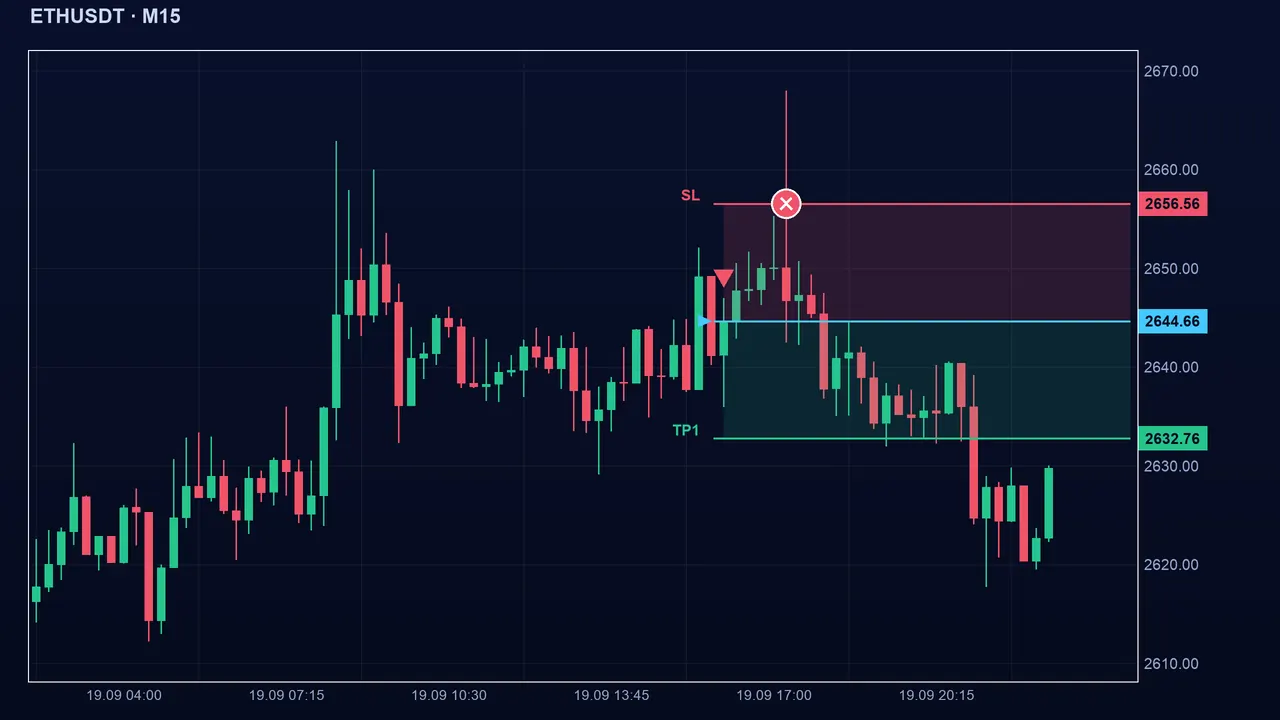
- A pattern does not guarantee a reversal; put a stop beyond X.
📝 Lesson test
Log in to take this lesson’s test. Once you have passed all the tests, you will receive a certificate in your name.
Log inThese lessons are for understanding and are not investment advice. No method guarantees winning.