
What is cumulative delta for?
A candle’s delta is the gap between what was bought and what was sold at market. Cumulative delta, or CVD (Cumulative Volume Delta), adds these gaps up over time. It answers one question: over time, have buyers or sellers taken the upper hand? A rising price with a rising CVD is “supported”; a rising price with a flat or falling CVD leaves room for doubt.
How it is calculated
On every candle, Algo Signals computes a ratio between −1 and +1 and multiplies it by the volume: that is the candle’s delta. The CVD is the sum of all these deltas since the first loaded candle. It then compares the CVD with its own simple moving average.
- With real volume (Binance crypto pairs): ratio = (buy volume − sell volume) / (buy volume + sell volume), volume = buy + sell. The delta is therefore simply buy − sell.
- Without volume (Deriv: synthetics, forex, metals, indices): the volume is an estimate. The ratio is (close − open) / (high − low) and the “volume” is high − low, which makes the delta equal to close − open. The CVD becomes the sum of candle bodies, not a real order flow.
- State: bullish if the CVD is above its simple moving average over 20 candles (the “period” setting), bearish if below, neutral if equal or if history is too short.
How to read the signal in Algo Signals
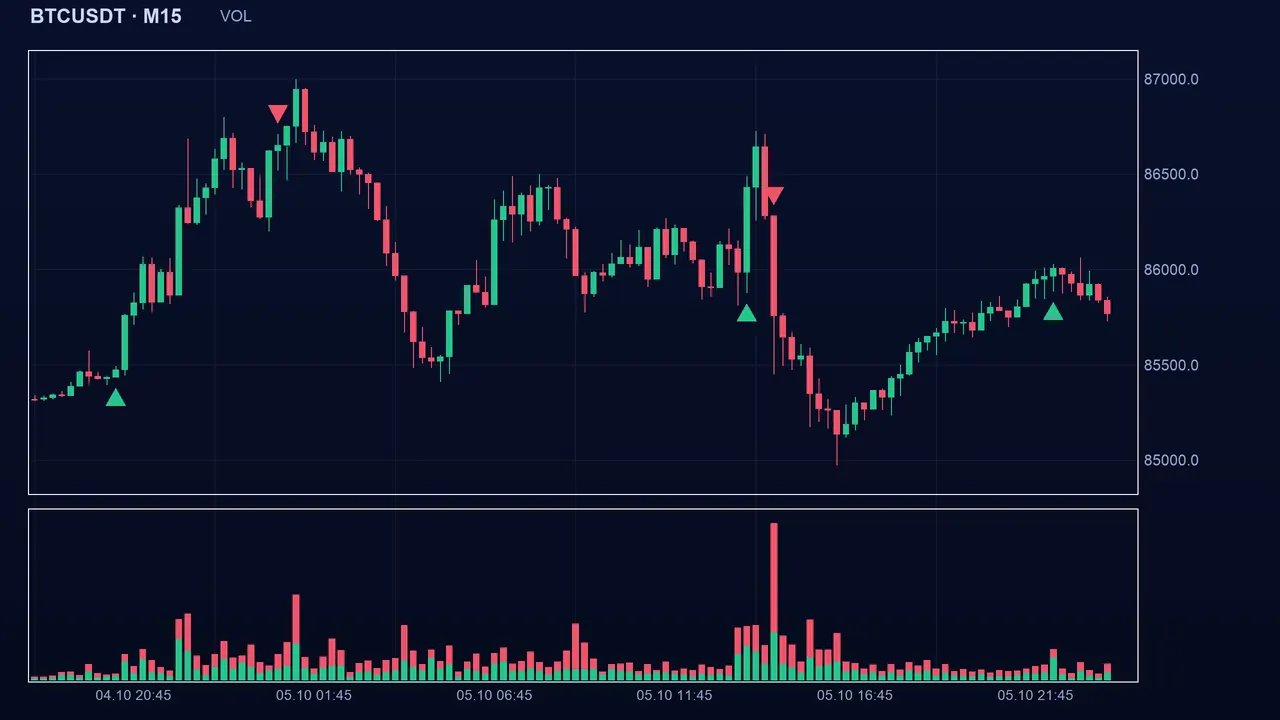
The CVD alone has no absolute meaning: it starts at the first loaded candle. What matters is its position relative to its average, and shifting the starting point does not change the result. When the CVD crosses above its average the state turns bullish (buy signal); when it crosses below, bearish (sell signal). Volume weighs in: a very high-volume candle moves the CVD more than ten small ones.
The settings
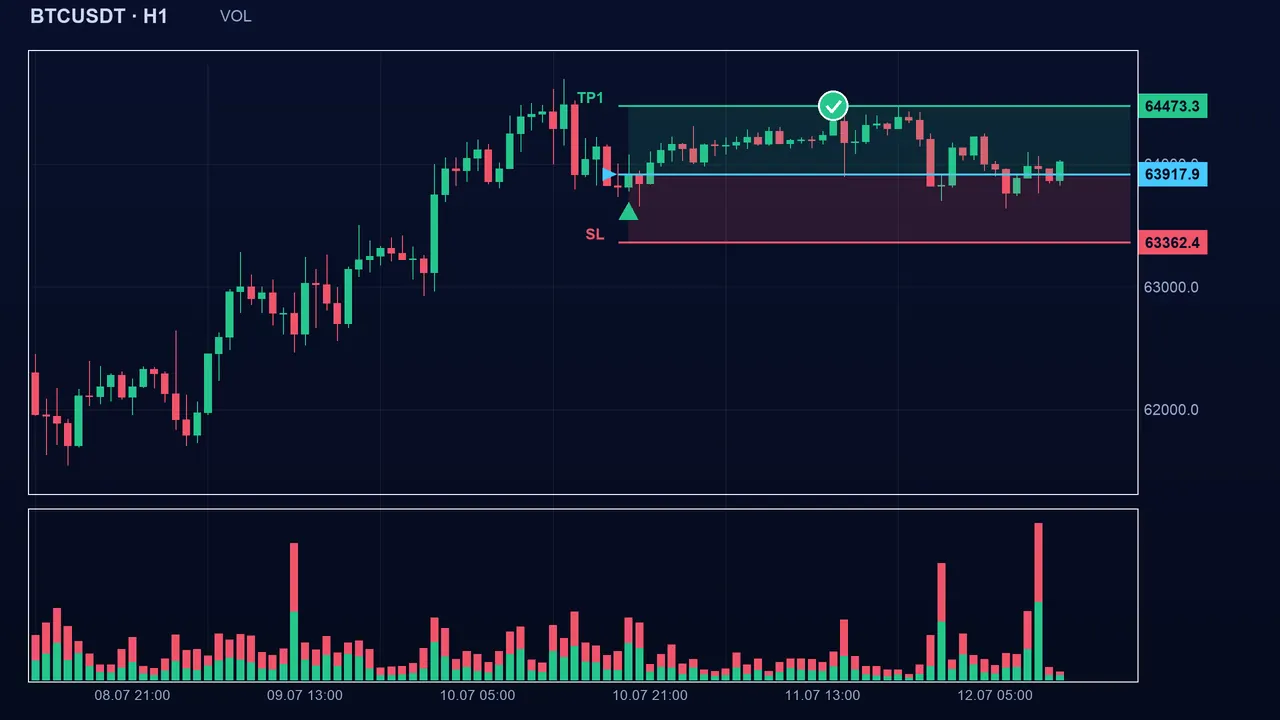
- Period (period, 20 by default, from 2 to 300): length of the CVD average. Smaller, the state reacts fast and changes often; larger, it is steady but late.
- The base calculation (ratio, volume) cannot be adjusted: it depends on the data source, real on Binance, estimated on Deriv.
The pitfalls
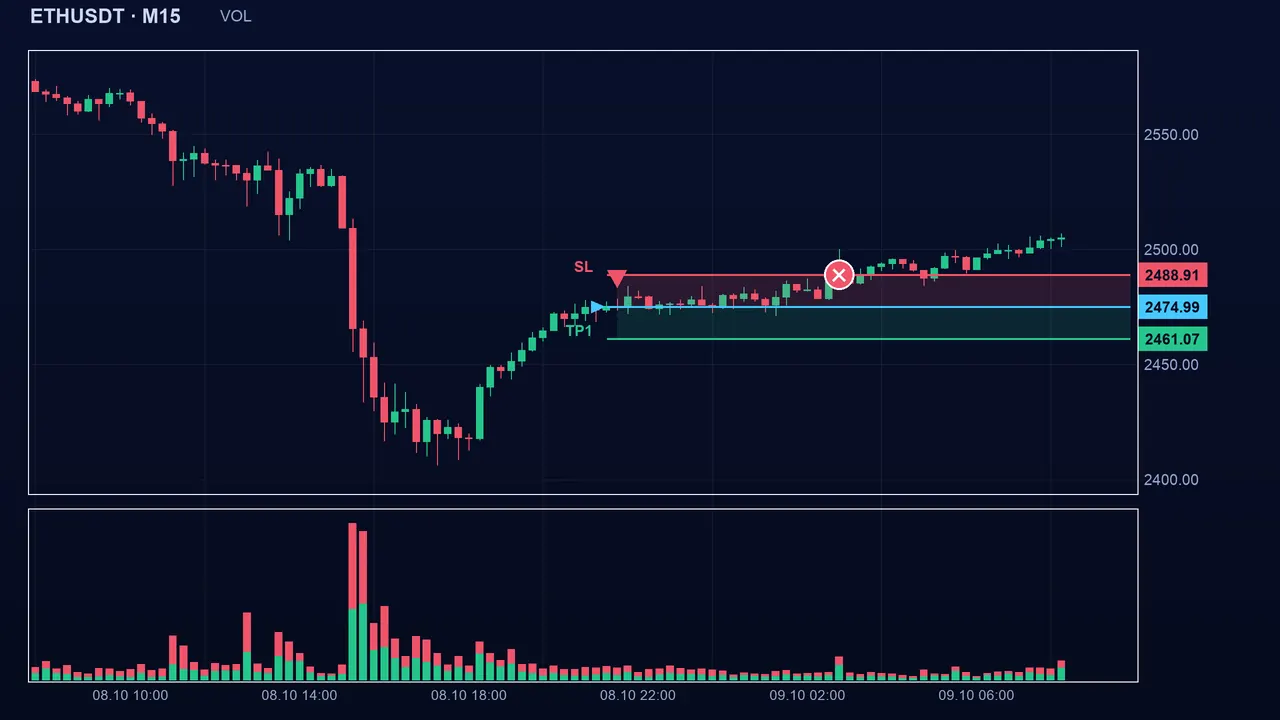
In a directionless market, the CVD oscillates around its average and the state changes on every candle. On Deriv, since the delta is simply close − open, the CVD looks a lot like a price indicator: it adds no flow information. Finally, a single large volume can dominate several candles.
Key takeaways
- CVD = sum of deltas (ratio × volume) candle after candle; state = CVD above or below its average over 20 candles.
- On Binance, buy / sell volume is real; on Deriv, it is estimated and the delta reduces to close − open.
- Only the gap to the average matters, not the absolute value.
- Combine it with the footprint, volume imbalance and the trend, and always keep a stop.
📝 Lesson test
Log in to take this lesson’s test. Once you have passed all the tests, you will receive a certificate in your name.
Log inThese lessons are for understanding and are not investment advice. No method guarantees winning.