
What is the footprint for?
A green candle says price went up, not how much buying force it took. The footprint tries to measure pressure: on a candle, did aggressive buyers beat aggressive sellers? The clearer the gap, the more the candle is “carried” by one side. It is a reading aid, not a forecast.
How it is calculated
For each candle, Algo Signals computes a value between −1 (all sellers) and +1 (all buyers), then smooths it. Everything depends on the data available.
- With real volume (Binance crypto pairs, such as BTCUSDT): (buy volume − sell volume) / (buy volume + sell volume). This is a real delta, measured on market orders.
- Without volume (Deriv: synthetic indices, forex, metals, indices): the site has no buy / sell volume. It then uses an estimate from the shape of the candle: (close − open) / (high − low). It is a proxy, not real volume.
- Smoothing: simple average over 5 candles (the “smooth” setting).
- Threshold: if the average is above +0.15 the state is bullish, if below −0.15 it is bearish, otherwise neutral.
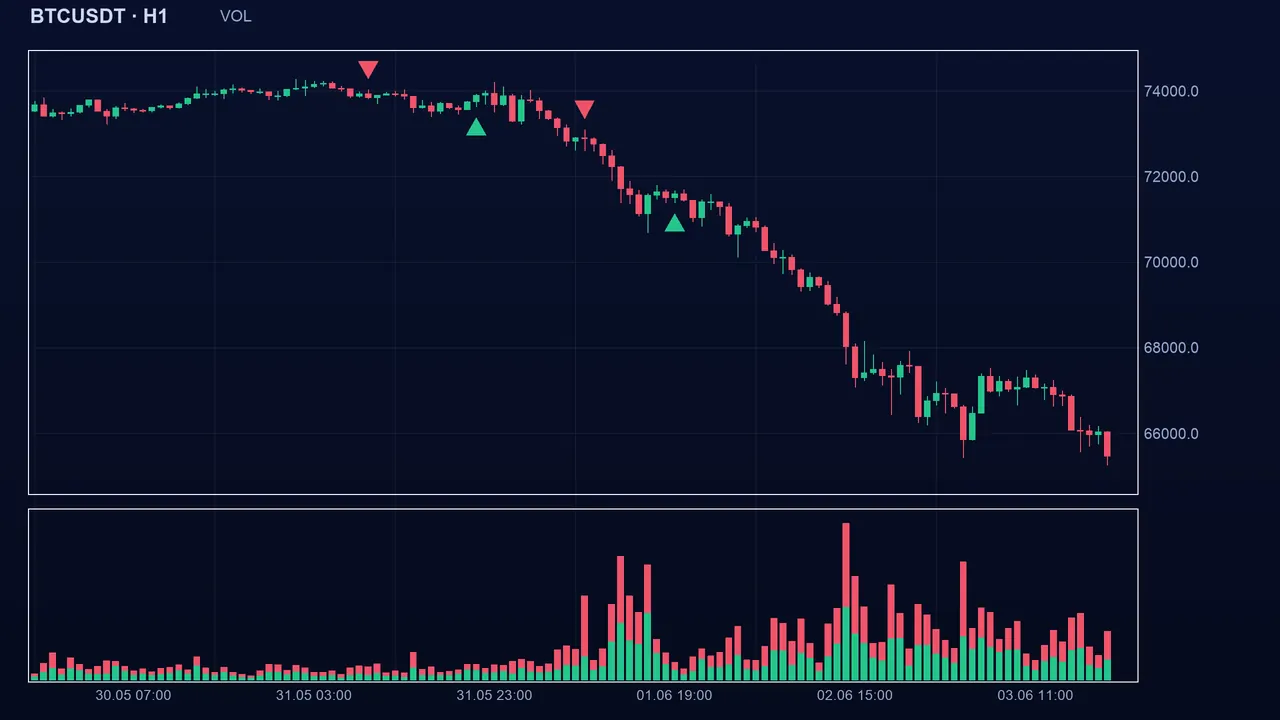
How to read the signal in Algo Signals
The state is recomputed on every candle: bullish while the average pressure stays above the threshold, bearish below the negative threshold, neutral in between (it is not “held” like event-based indicators). The buy or sell signal appears when the state flips. On Deriv, remember that what you see is an estimate drawn from the shape of the candles: it looks more like a momentum indicator than a real reading of the flow.
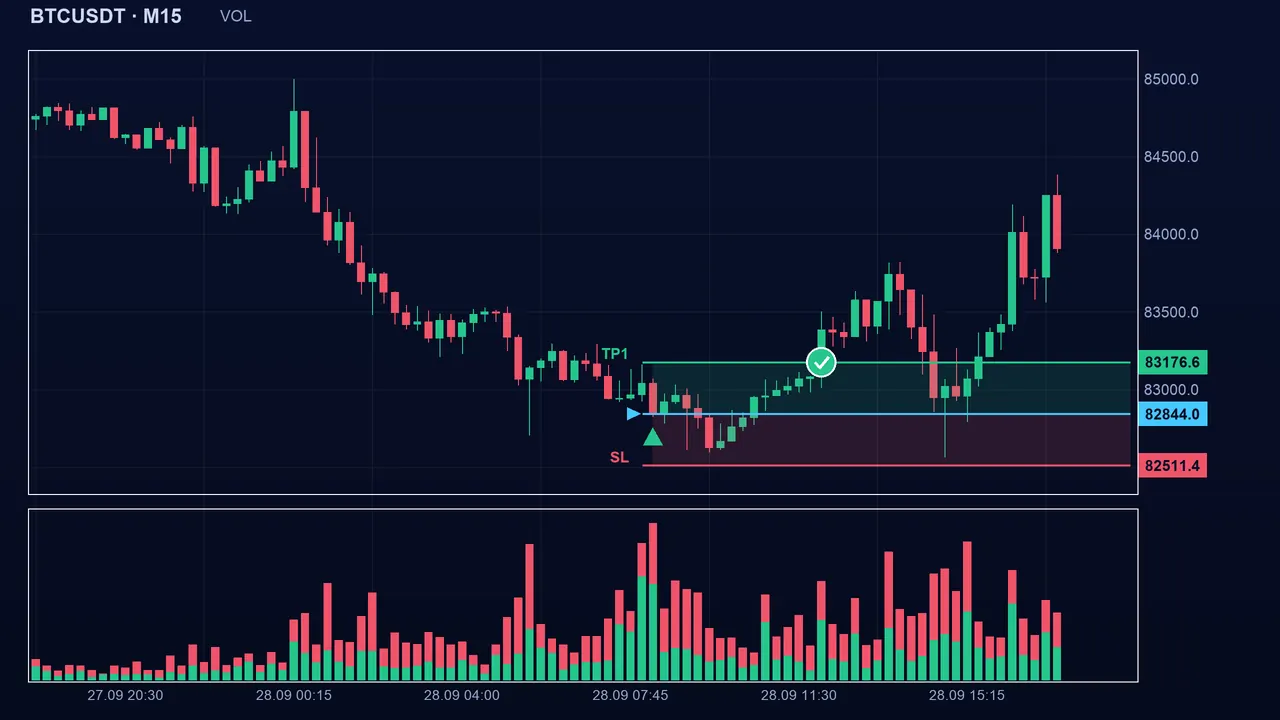
The settings
- Smoothing (smooth, 5 by default, from 1 to 100): smaller, the state reacts fast and changes often; larger, it is steady but late.
- Trigger threshold (threshold, 0.15 by default, from 0 to 1): larger, a clearer pressure is needed; at 0, the slightest excess gives a state.
The pitfalls
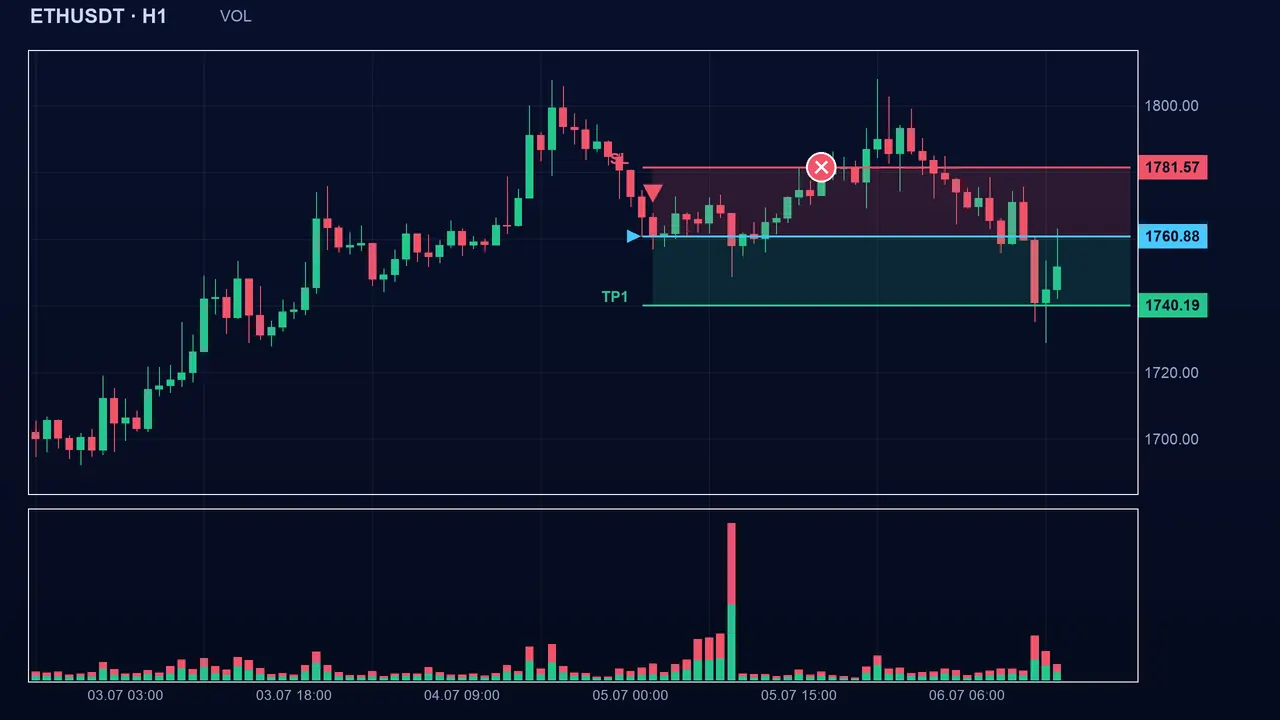
An average lags: it can stay positive just as the pressure has vanished. On Deriv, the estimate does not see real volume: a candle with a long wick and a small body can look neutral although a lot traded. Even on Binance, the volume of a single venue is not the whole market.
Key takeaways
- Candle value: (buy − sell) / (buy + sell) with Binance’s real volume; otherwise (close − open) / (high − low), an estimate on Deriv.
- Bullish state above +0.15, bearish below −0.15, neutral in between, on a 5-candle average.
- The average makes the indicator late; on Deriv it is not a real order flow.
- Combine it with the trend, a structure zone and a flow indicator such as cumulative delta, and always keep a stop.
📝 Lesson test
Log in to take this lesson’s test. Once you have passed all the tests, you will receive a certificate in your name.
Log inThese lessons are for understanding and are not investment advice. No method guarantees winning.