A classic moving average has a fixed speed: too slow in a trend, too jumpy in a confused market. The FRAMA (Fractal Adaptive Moving Average) changes speed by itself depending on how “rough” prices are. Algo Signals builds an indicator from it: frama.
What the FRAMA is for
When price runs straight, the FRAMA moves quickly toward price so as not to lag. When price zigzags in a zone, it almost freezes, so it is not shaken on every candle. The idea is to combine responsiveness and stability by letting prices choose the speed.
How it is calculated
With a period N = 16 (made even if needed) and h = N ÷ 2 = 8, three ranges are measured: N1 = (highest high − lowest low) of the last 8 candles ÷ 8; N2 = the same over the 8 candles before; N3 = (highest high − lowest low) of the 16 candles ÷ 16. The fractal dimension is D = (ln(N1 + N2) − ln N3) ÷ ln 2, between 1 (straight line) and 2 (dense zigzag). The coefficient is α = exp(−4.6 × (D − 1)), bounded between 0.01 and 1. Then FRAMA = α × close + (1 − α) × previous FRAMA. The state is bullish if the close is above the FRAMA, bearish if below, neutral if equal.
Reading the signal in Algo Signals
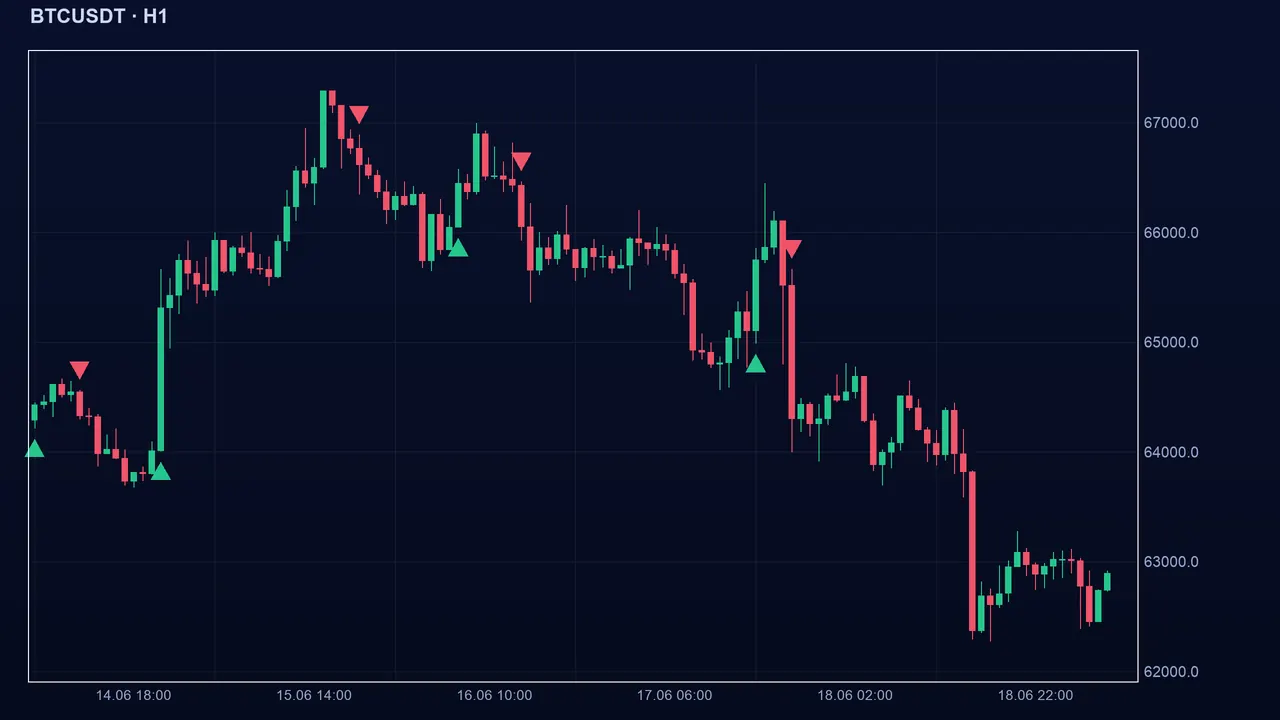
The FRAMA line is read like any average: the buy signal appears when the close goes from below the FRAMA to above it, the sell signal the other way. The difference is that the line does not always have the same speed: it hugs price in a clean trend and stays almost still when the market oscillates. The state stays neutral until the first N candles are available.
The setting
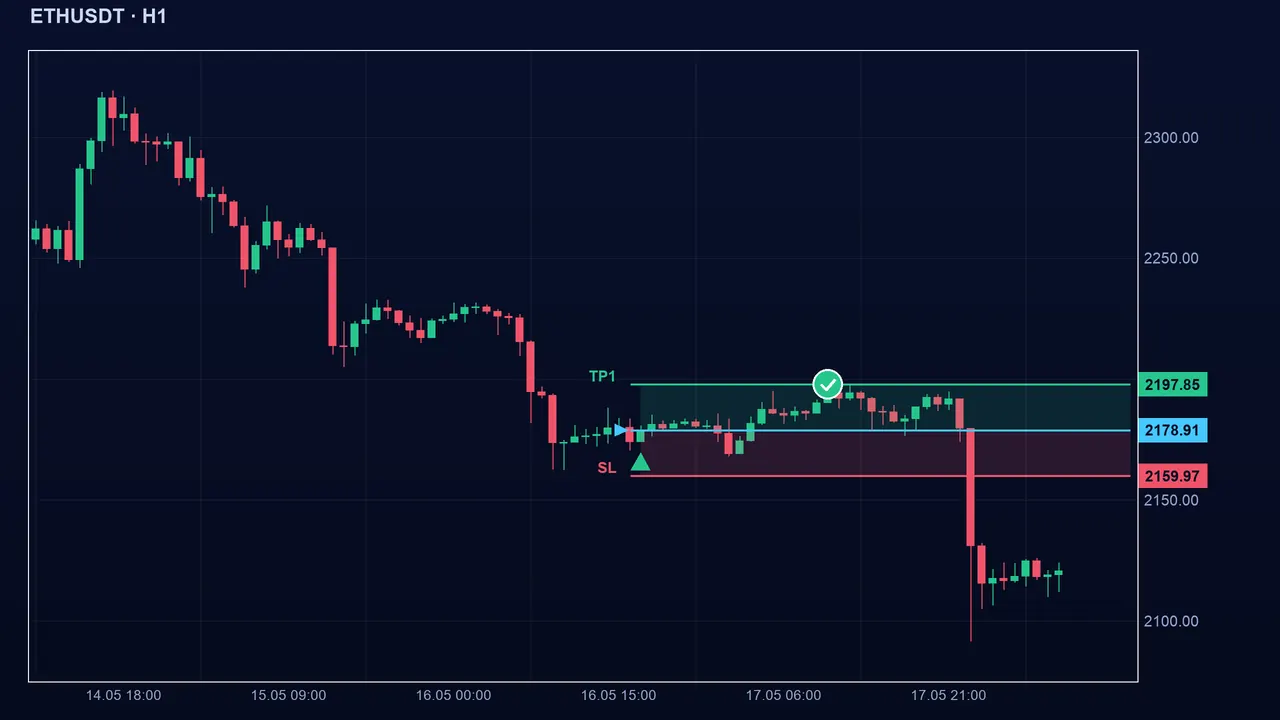
- Period (period): 16 by default, adjustable from 4 to 200. An odd period is rounded down to the even number below.
- The shorter the period, the fewer candles the FRAMA measures: it reacts faster but gets noisier.
- The longer it is, the steadier the roughness estimate, but the later the signal.
- If α reaches 1 (perfectly straight price), the FRAMA equals the close and the state is neutral.
The traps
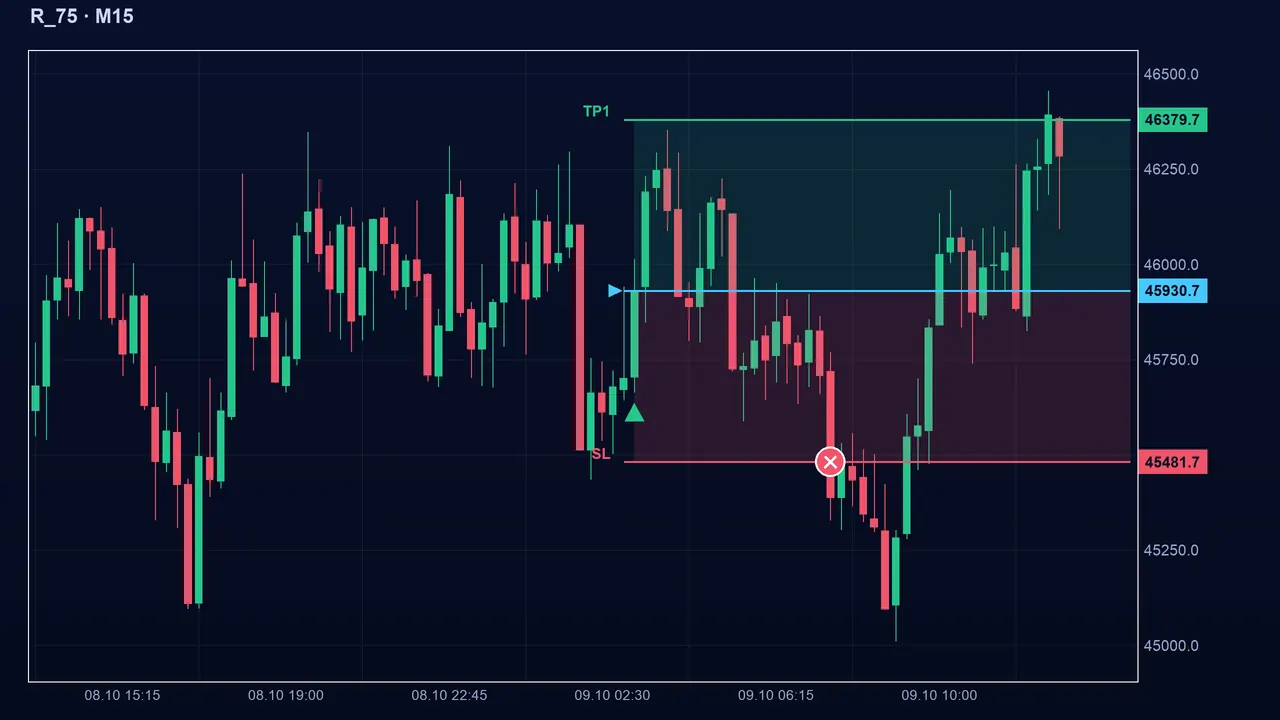
In a market with no direction, α falls toward 0.01: the FRAMA barely moves and each close flips from one side of that frozen line to the other. The result: a burst of contradictory signals.
Key takeaways
- The FRAMA adapts its speed to the roughness of prices (fractal dimension D between 1 and 2).
- The signal is the close crossing the FRAMA; in a confused market the line freezes and the crossings multiply.
- Its single setting (period 16) changes sensitivity, not the nature of the risk.
- Pair it with a trend-strength indicator (ADX) to know whether the market is directional.
📝 Lesson test
Log in to take this lesson’s test. Once you have passed all the tests, you will receive a certificate in your name.
Log inThese lessons are for understanding and are not investment advice. No method guarantees winning.