
What is the Chandelier Exit for?
The Chandelier Exit, popularised by Chuck LeBeau, answers a risk manager’s question: where to put a stop that lets a trend breathe without staying needlessly far away? Like a chandelier hanging from the ceiling, the stop hangs below the recent high (for a long position) or rises from the recent low (for a short). The distance depends on volatility: when the market gets agitated the stop moves away; when it calms down, it moves closer.
How it is calculated
- ATR: simple average of the true ranges of the last 22 candles.
- Long stop = highest high of the last 22 candles − 3 × ATR. Short stop = lowest low of the last 22 candles + 3 × ATR.
- The long stop can only rise while price stays above it; the short stop can only fall while price stays below it. It “ratchets”.
- State: buy if the close is above the short stop, sell if it is below the long stop, otherwise the previous state is kept. The starting state is buy and the indicator starts after 22 candles. It does not repaint.
Reading the signal in Algo Signals
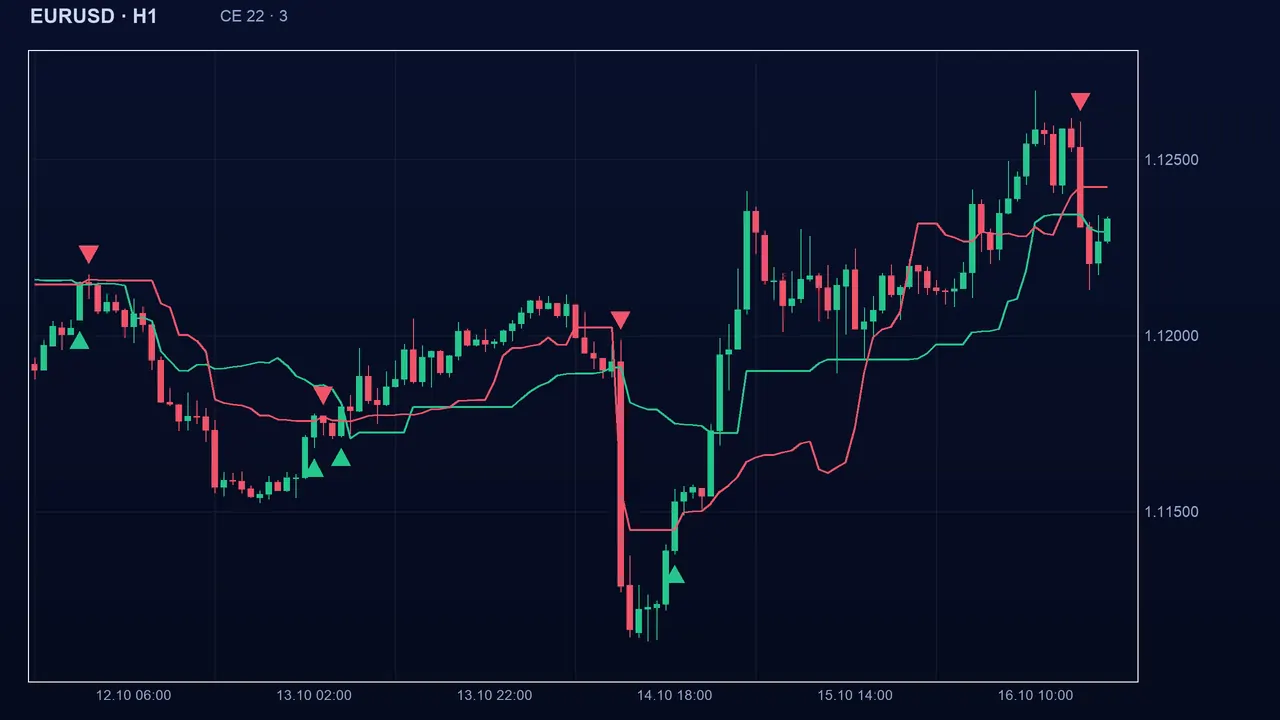
The sell signal appears when the close goes below the long stop: the state flips from buy to sell. The buy signal appears when the close goes above the short stop. Between two flips the state is kept and the indicator keeps voting the same way. The chart shows two stop lines; the opposite line can also serve as a reference for placing your own stop.
The settings
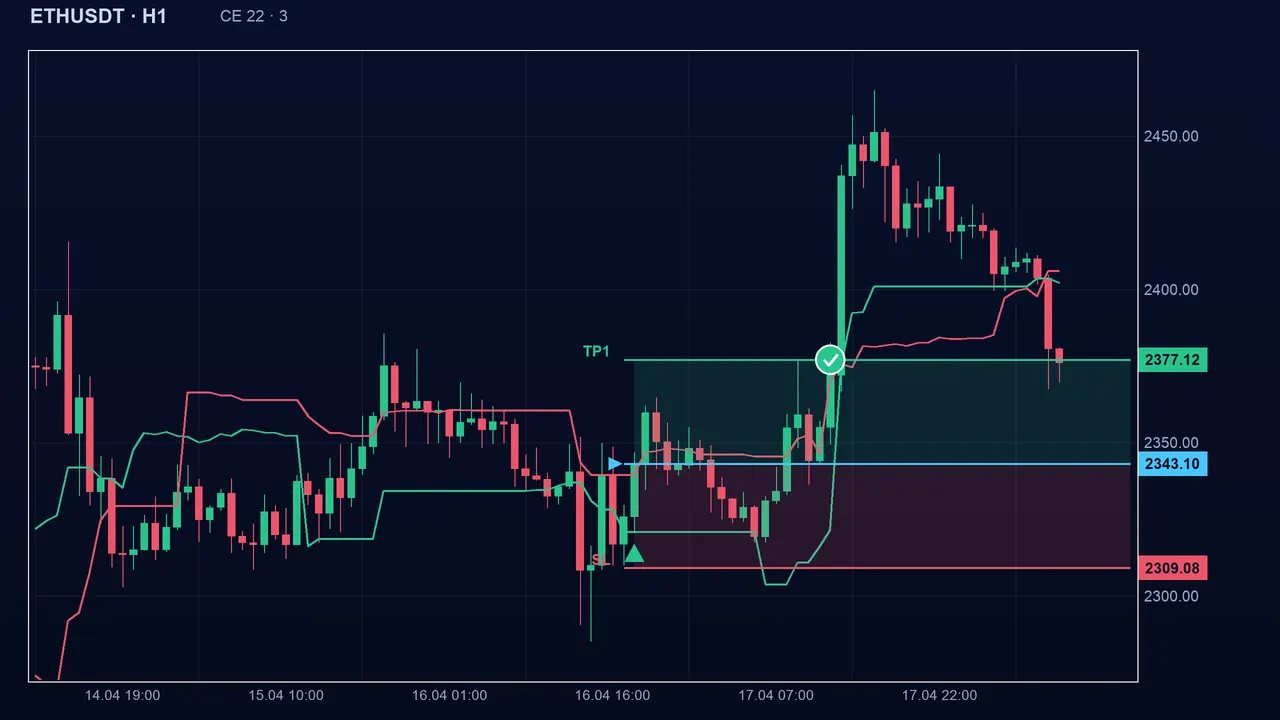
- Period: 22 by default (2 to 200). Shorter: the recent high changes fast and the stops follow price closely. Longer: steadier stops, rarer flips.
- ATR multiplier: 3.0 by default (0.5 to 10). Smaller: tight stops, many flips and false signals. Larger: distant stops, few flips, but each comes after an already large move.
- These values are common conventions, not proven optima.
The pitfalls
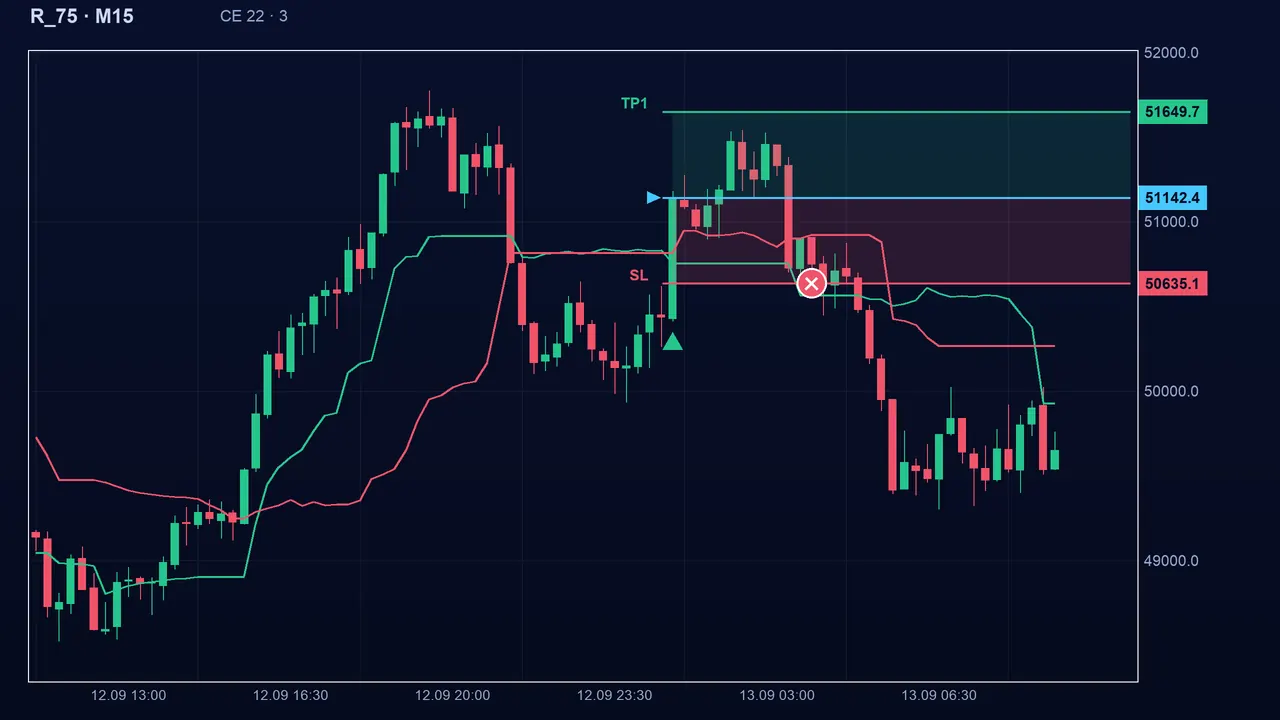
The Chandelier Exit is built to get out of a trend, not to detect its start: it reacts after a pullback has already developed. In a market with no direction it flips from side to side repeatedly. Since the ATR is an average, a single extreme event is enough to widen it: on Boom/Crash, a spike inflates the ATR for 22 candles and pushes the stops far away. Finally, the starting “buy” state is not a real signal.
Key takeaways
- Long stop = highest high of 22 candles − 3 × ATR; short stop = lowest low of 22 candles + 3 × ATR.
- Close below the long stop: sell. Close above the short stop: buy. In between: the state is kept.
- It follows volatility, but a spike widens the stops for many candles, and it struggles in a market with no direction.
- Default settings: period 22, multiplier 3.0.
📝 Lesson test
Log in to take this lesson’s test. Once you have passed all the tests, you will receive a certificate in your name.
Log inThese lessons are for understanding and are not investment advice. No method guarantees winning.