
A price rises, falls, rises again… How do you know whether the trend has really changed? The moving-average crossover, called macross in Algo Signals, answers with two smoothed lines: when the fast one moves above the slow one, the recent trend turns up.
What the crossover is for
A moving average smooths prices to remove noise. The fast average reacts quickly but moves a lot; the slow one is calmer but late. Comparing them asks: is recent price above or below its older trend? It is one of the oldest ideas in technical analysis.
How it is calculated
Algo Signals computes two exponential averages (EMA) on closing prices: a fast one over 9 candles and a slow one over 21. An EMA gives more weight to recent candles: EMA = close × k + previous EMA × (1 − k), with k = 2 ÷ (period + 1). That gives k = 0.2 for period 9 and k ≈ 0.0909 (2 ÷ 22) for 21. The first value is the simple average of the first closes. The state is bullish if the fast EMA is above the slow one, bearish if below, neutral if they are equal or candles are missing.
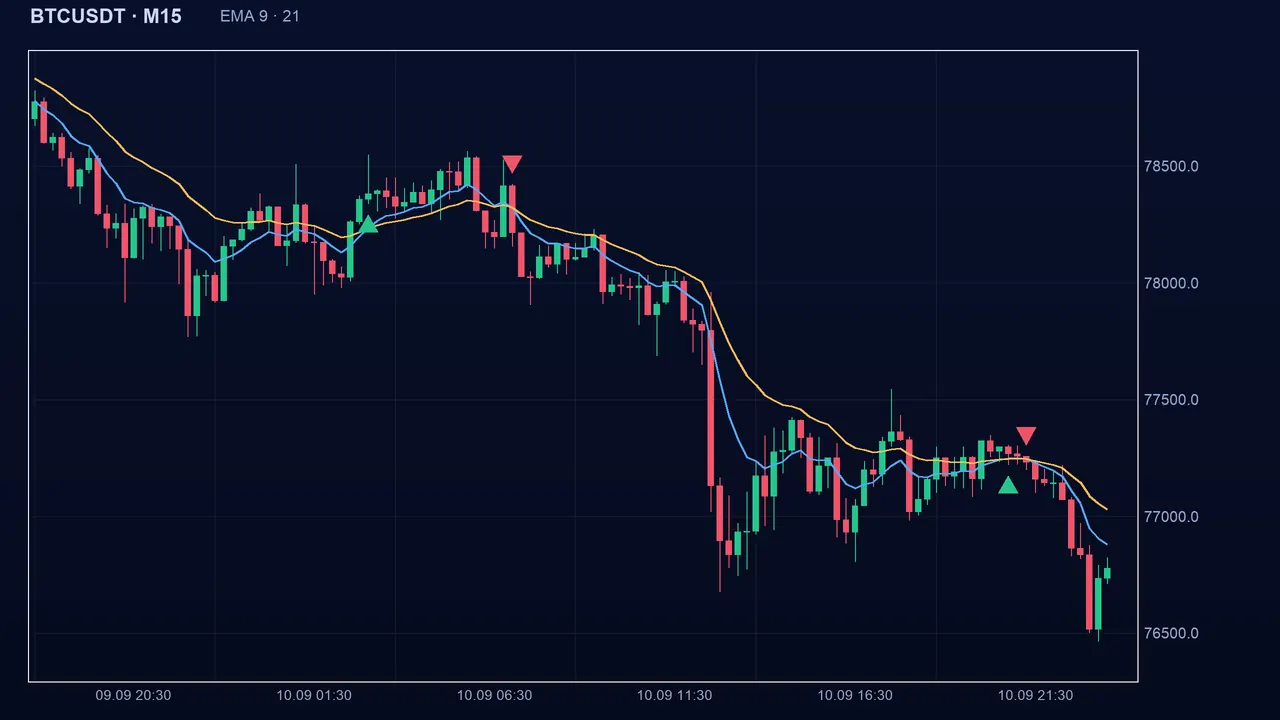
Reading the signal in Algo Signals
Macross gives a state on every candle. The buy signal appears when the state goes from bearish to bullish (the fast average crosses above the slow one), the sell signal when it goes from bullish to bearish. On the chart you see both lines and a mark at each crossover. If you tick other indicators, they must agree according to the threshold you choose.
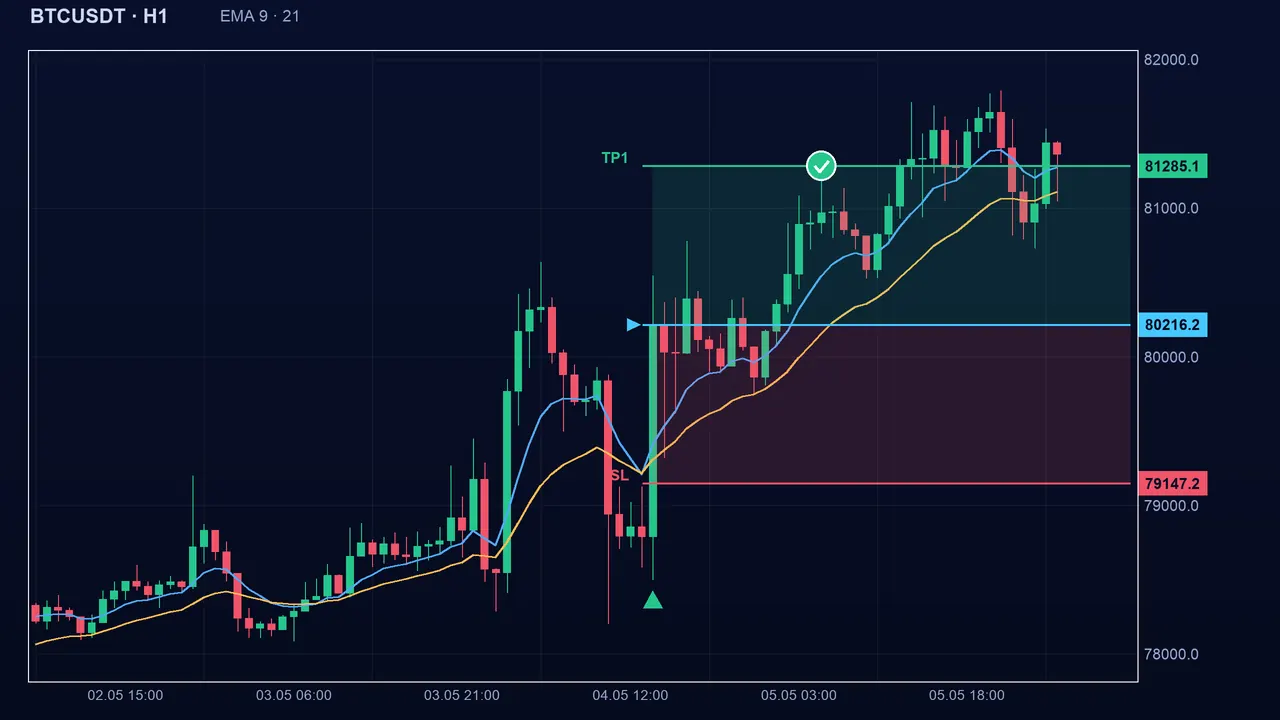
The settings
- Fast (fast): 9 by default, adjustable from 1 to 200. Smaller, the line hugs price and crosses more often.
- Slow (slow): 21 by default, adjustable from 1 to 400. Larger, crossovers are rarer and later.
- Always keep fast < slow: if you swap them, the signal direction flips too. Pairs such as 50 and 200 are popular, but that habit is not a proven rule.
The traps
An EMA summarizes the past: the crossover comes after the move has started. Worse, when the market has no direction the two lines tangle and cross over and over. A sudden jump like on Boom or Crash also crosses too late to be useful.
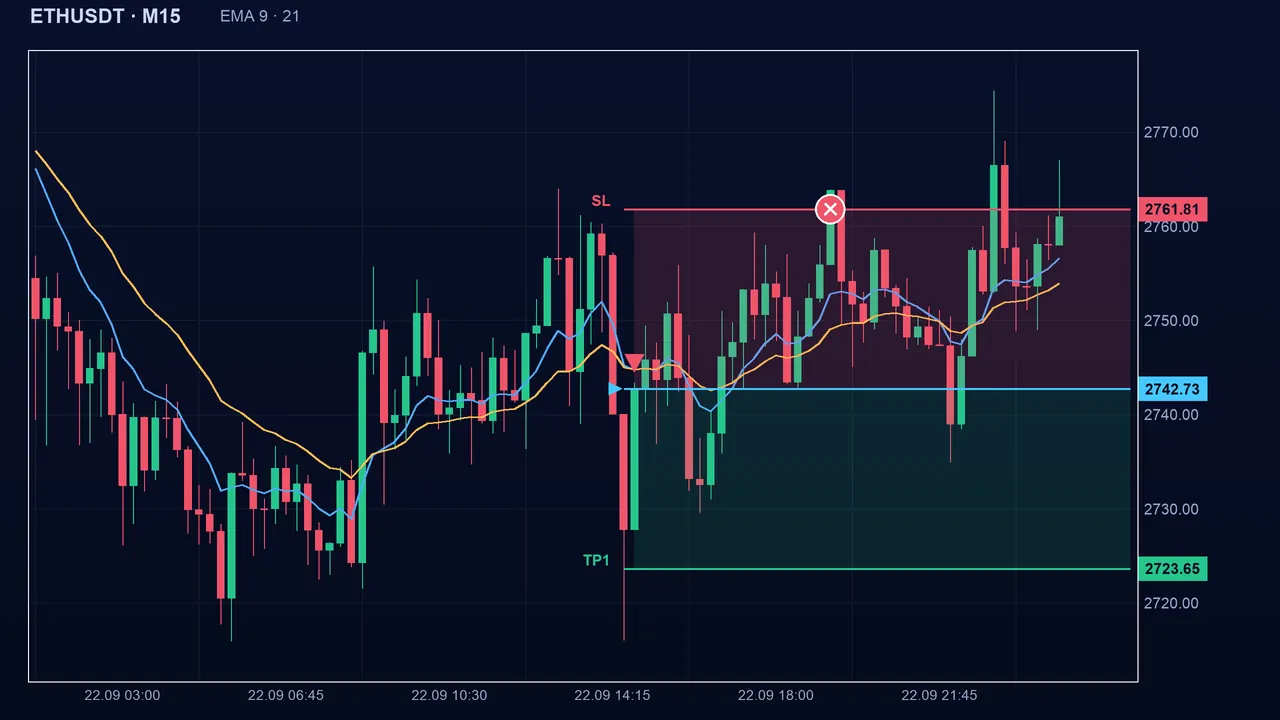
Key takeaways
- Macross compares a fast EMA (9) and a slow EMA (21); the signal is the change of side.
- It is late by construction and gets lost when the market has no trend.
- A worked example is never a forecast: practise on a demo account before any real money.
- Pair it with a strength or volatility indicator (ADX, ATR) to spot directionless markets.
📝 Lesson test
Log in to take this lesson’s test. Once you have passed all the tests, you will receive a certificate in your name.
Log inThese lessons are for understanding and are not investment advice. No method guarantees winning.