The 100- and 200-candle averages are among the most watched lines on a chart. Many traders use them to place price against its underlying trend. Algo Signals makes them two separate indicators: ma100 and ma200.
What the MA 100 and MA 200 are for
A 200-candle average sums up recent price behaviour over a long stretch. It moves slowly: it is a background reference, not a detector of small moves. The question is simple: does price close above or below this reference?
How they are calculated
It is a simple moving average (SMA) of closing prices: add the last N closes and divide by N, with N = 100 for ma100 and N = 200 for ma200. With each new candle the oldest one leaves the window: new SMA = old SMA + (new close − leaving close) ÷ N. The state is bullish if the close is above the SMA, bearish if below, neutral if equal or if the history is too short to compute the average.
Reading the signal in Algo Signals
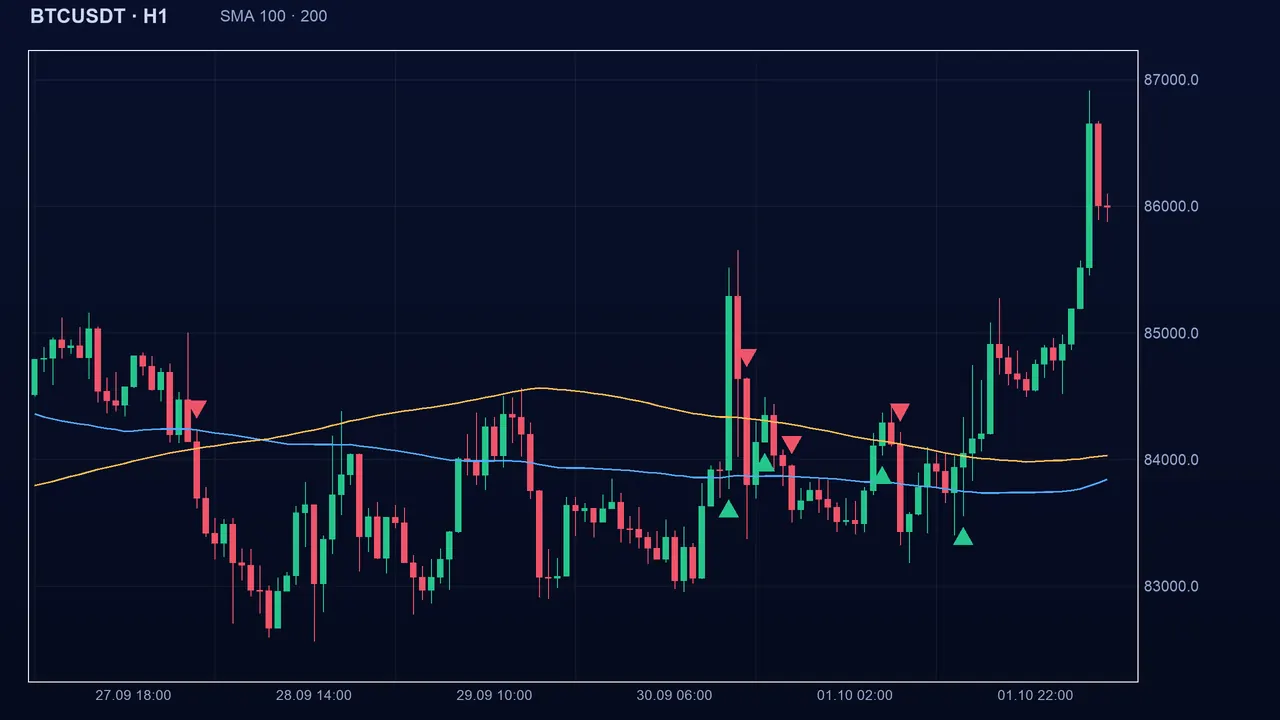
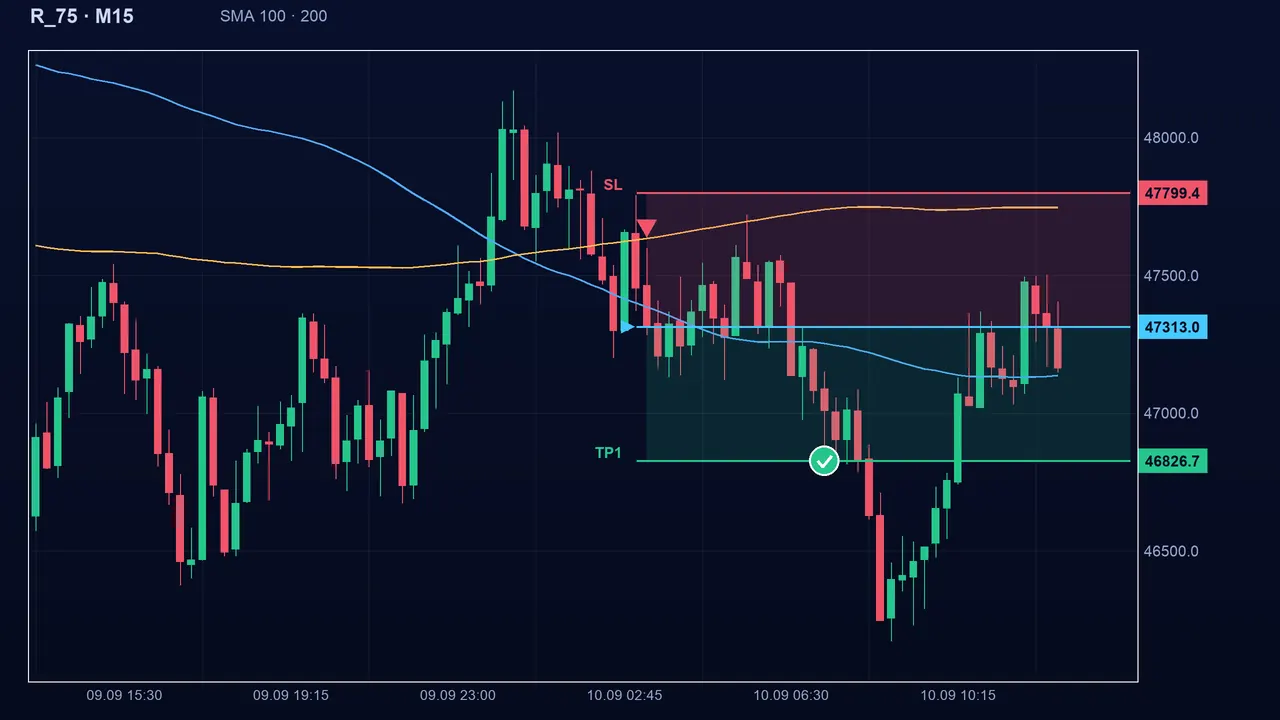
Each indicator gives a state on every candle. The buy signal appears when the close goes from below the average to above it; the sell signal when it falls back below. The average line is drawn on the chart, so you can see at a glance which side price is on. Both indicators are ticked in the starting selection, along with macross, macd and supertrend.
The settings
- MA 100 period (period): 100 by default, adjustable from 1 to 500.
- MA 200 period (period): 200 by default, adjustable from 1 to 1000.
- The shorter the period, the closer the line follows price and the more often it flips; the longer, the steadier but later it is.
- Using the MA 200 as a filter (buy only above it) is a common habit, not a proven rule.
The traps
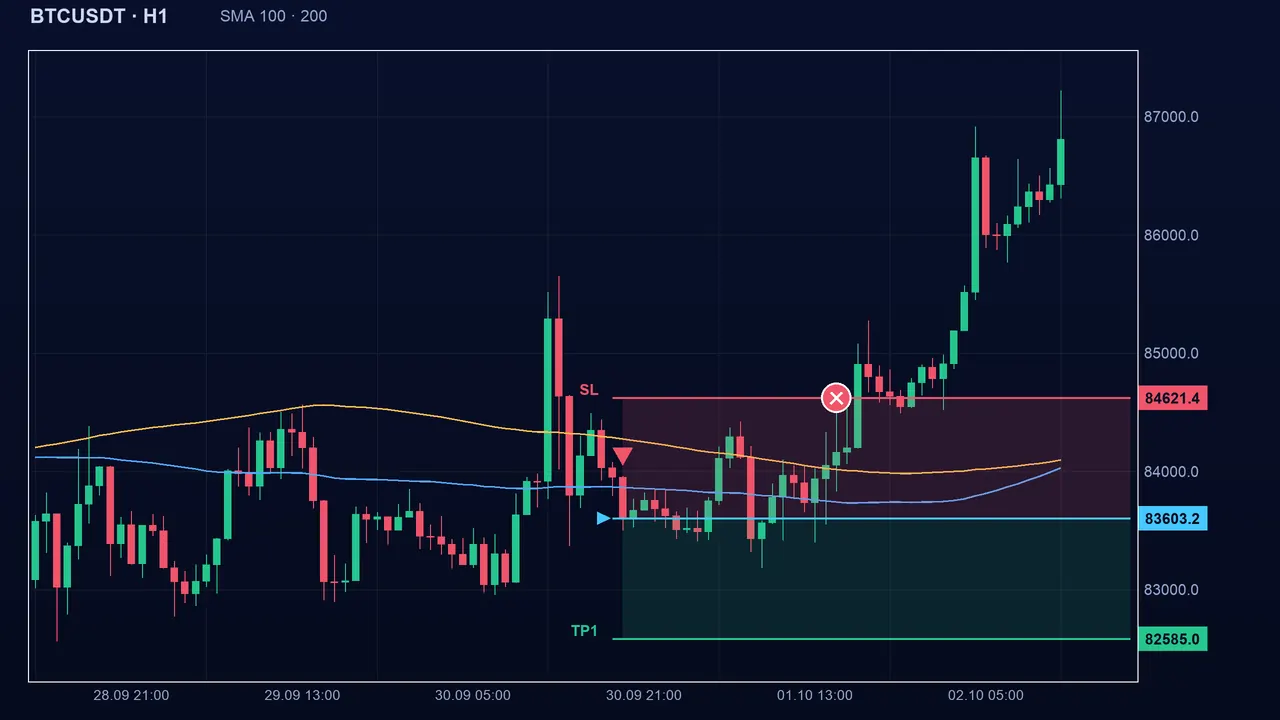
The average is slow: the signal arrives late, often well after the move began. And when price wanders around the line it crosses it constantly: every crossing becomes a signal, most of them going nowhere.
Key takeaways
- ma100 and ma200 compare the close with a simple average over 100 or 200 candles.
- The signal is the close crossing the line; it is slow by construction.
- Around the line, crossings multiply and cost a lot in small losses.
- Combine them with a trend-strength indicator (ADX) or a faster crossover (macross) before deciding.
📝 Lesson test
Log in to take this lesson’s test. Once you have passed all the tests, you will receive a certificate in your name.
Log inThese lessons are for understanding and are not investment advice. No method guarantees winning.