
Where has the most volume traded in recent days? Many traders watch that spot, because it is where the market spent the most time and exchange. The volume profile makes it visible: instead of looking at volume over time, it looks at volume by price level.
What it is for
The volume profile draws a “map” of prices: heavily traded levels (accepted by the market) and lightly traded ones. The indicator derives a value area from it. When price closes above or below that area, it leaves what the market mostly accepted recently: that is a starting signal, bullish or bearish.
How it is calculated
- Window: the last 100 candles (current candle included). Take the window’s high and low and split that height into 24 equal price slices.
- Each candle drops its volume into the slice that contains its typical price, (high + low + close) ÷ 3.
- POC (Point of Control): the slice that received the most volume.
- Value area: starting from the POC, add the busier neighbour, slice after slice, until 70% of the total volume is covered. Its edges are the VAL (low) and the VAH (high).
On Binance, volume is real. On Deriv there is no real volume: the site uses an estimate (proxy), the candle’s height (high − low). The profile then gives more weight to big candles and does not measure real trades. Read it with caution.
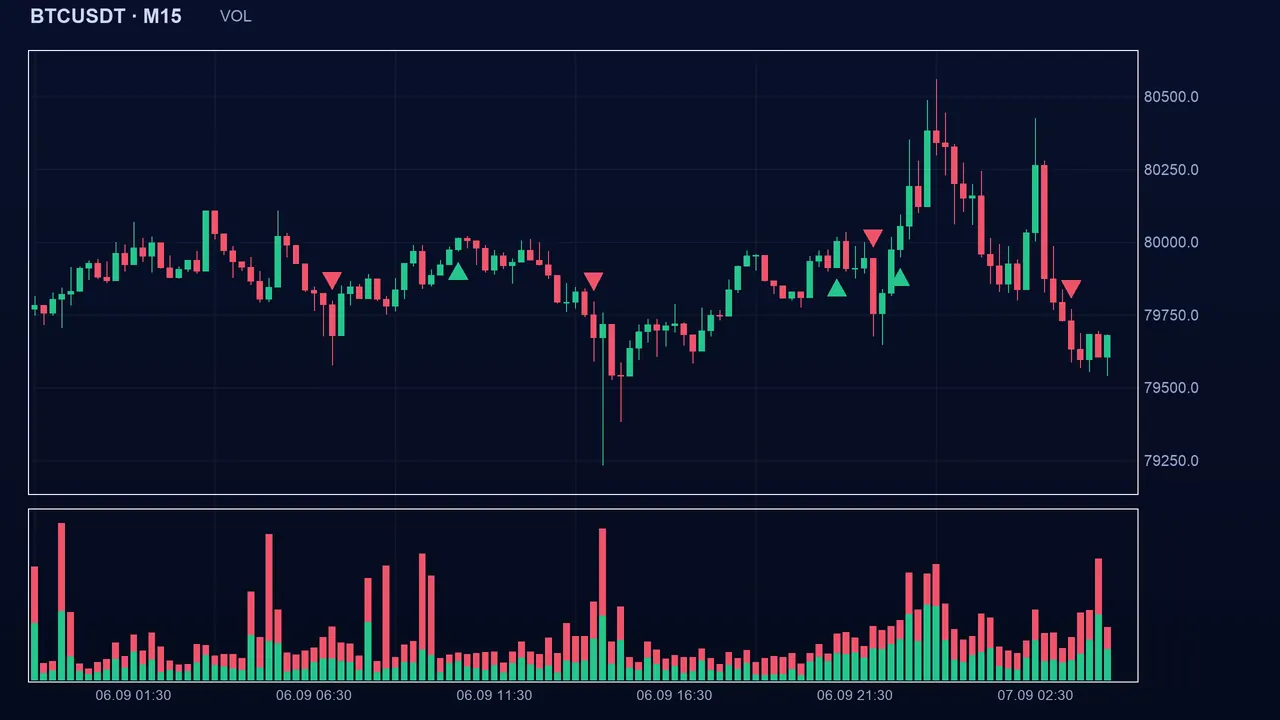
Reading the signal in Algo Signals
The state is bullish when the close is above the VAH, bearish when it is below the VAL, neutral inside. Unlike a rare signal, it is a state recomputed on every candle, and the area moves with the window. Algo Signals flags the moment the state flips, that is, an exit from the value area.
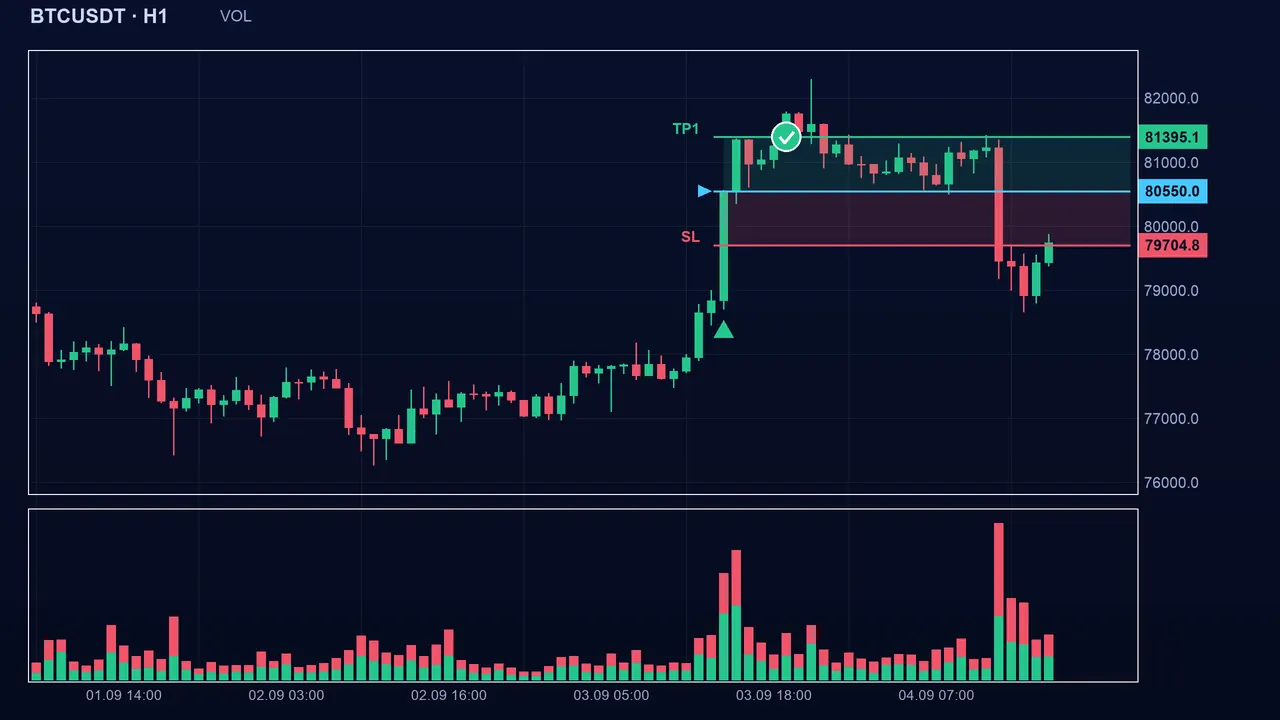
Settings and pitfalls
- Window (100, from 10 to 1000): the longer it is, the steadier the profile and the wider the area; the shorter, the faster it reacts.
- Price levels (24, from 6 to 100): the more there are, the more precise the POC but the more irregular the profile.
- Value area (0.7, from 0.3 to 0.95): the share of volume the area must cover. The larger it is, the wider the area and the rarer the exits.
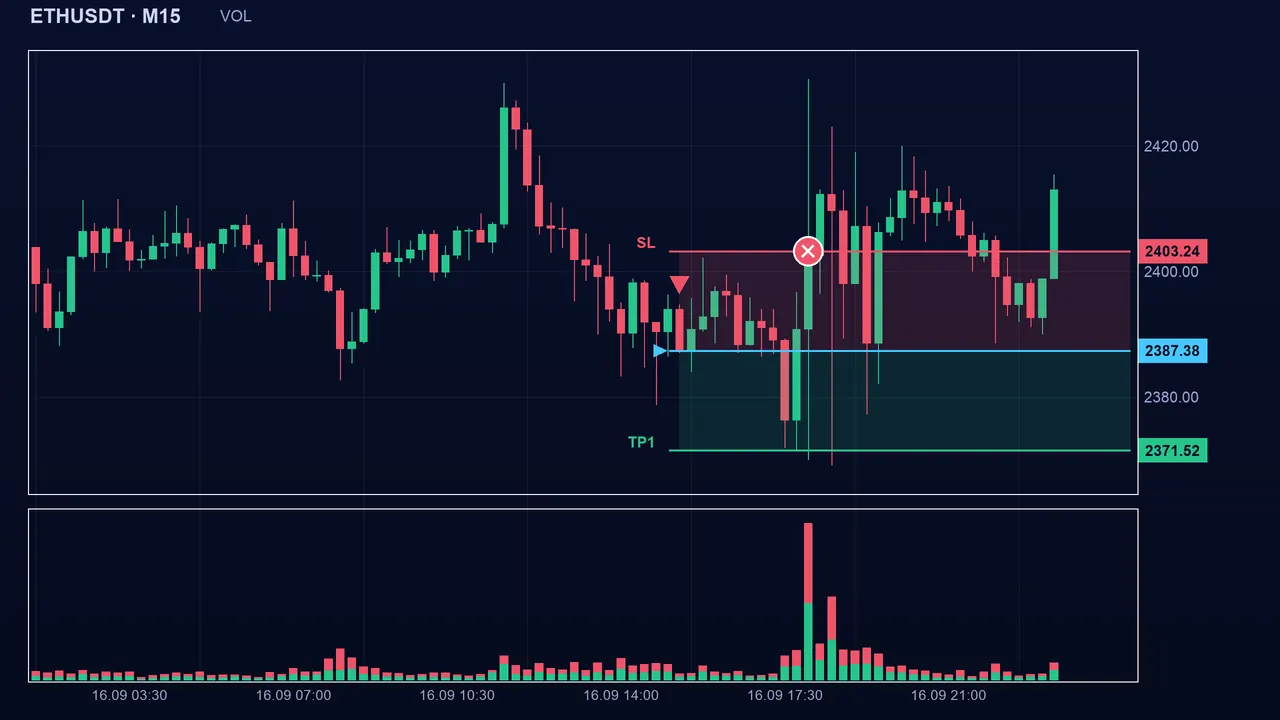
Key takeaways
- The POC is the most traded price slice in the window; the value area covers 70% of the volume around it.
- Close above the VAH: bullish state; below the VAL: bearish; inside: neutral.
- On Deriv, volume is an estimate taken from candle height, not real volume.
- The area is not fixed: it is recomputed on every candle over the window.
📝 Lesson test
Log in to take this lesson’s test. Once you have passed all the tests, you will receive a certificate in your name.
Log inThese lessons are for understanding and are not investment advice. No method guarantees winning.