
A suddenly huge volume means a market waking up: news, a big order, the end of a move. The Volume spike indicator spots those candles where activity clearly exceeds the usual, and keeps the candle’s direction.
What it is for
In a calm market, most candles have similar volume. When one has twice the usual, something is happening. The indicator does not try to explain why: it simply records the spike and the direction of the candle that carried it.
How it is calculated
- Candle volume: the real volume on Binance; on Deriv, an estimate, the candle’s height (high − low).
- Average: the mean volume of the last 20 candles, current candle included.
- Spike: volume greater than or equal to 2.0 times that average. Since the average contains the spike itself, this amounts to about 2.11 times the usual volume of the other 19 candles.
- Direction: buy if the candle closes above its open, sell if it closes below; a candle with no body triggers nothing. The state persists until the next spike in the opposite direction.
On Deriv there is no real volume. The “volume” is the candle’s height: a volume spike there simply means “abnormally large candle”. It is not a measure of real trades.
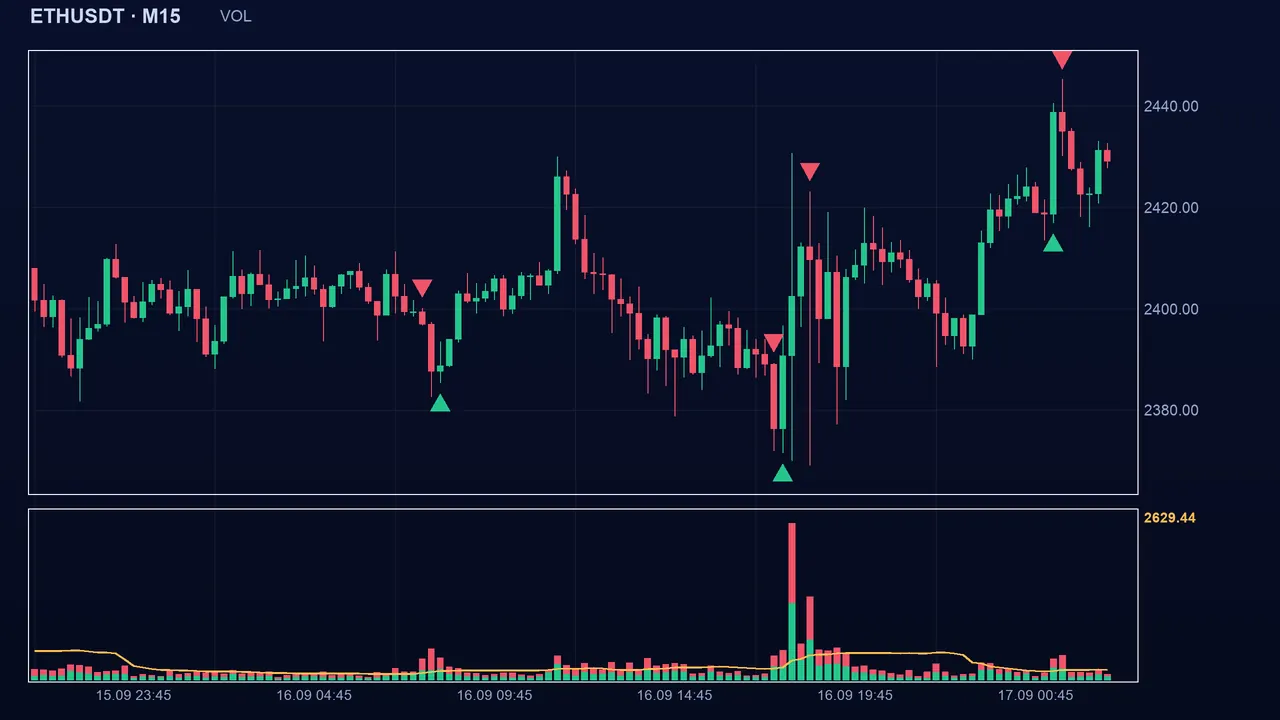
Reading the signal in Algo Signals
The spike marks a moment of unusual activity, with its direction. Algo Signals flags the moment the state flips, that is, the first spike in the opposite direction. Between two spikes the state stays in place, sometimes for a long time: it shows the direction of the last spike, not that the move continues.
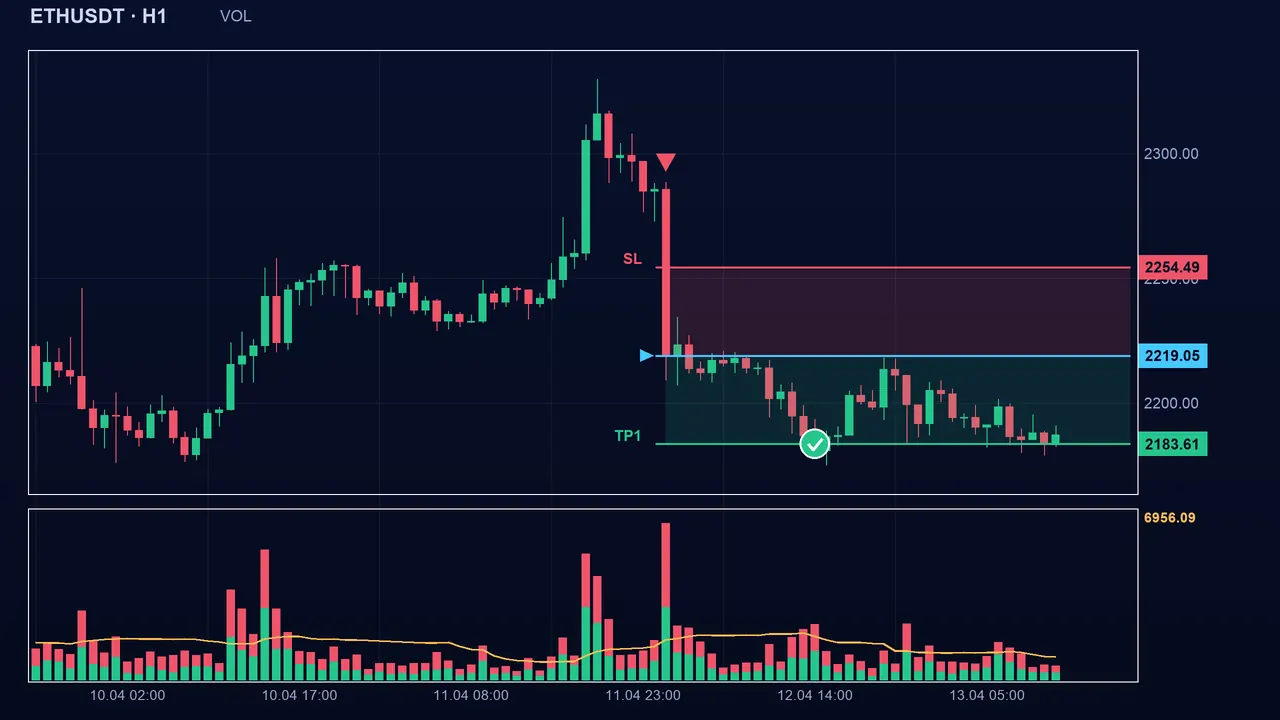
Settings and pitfalls
- Period (20, from 2 to 300): the number of candles in the average. The longer it is, the steadier the reference.
- Volume multiplier (2.0, from 1 to 10): the lower it is, the more numerous and ordinary the spikes; the higher it is, the rarer and more marked they are.
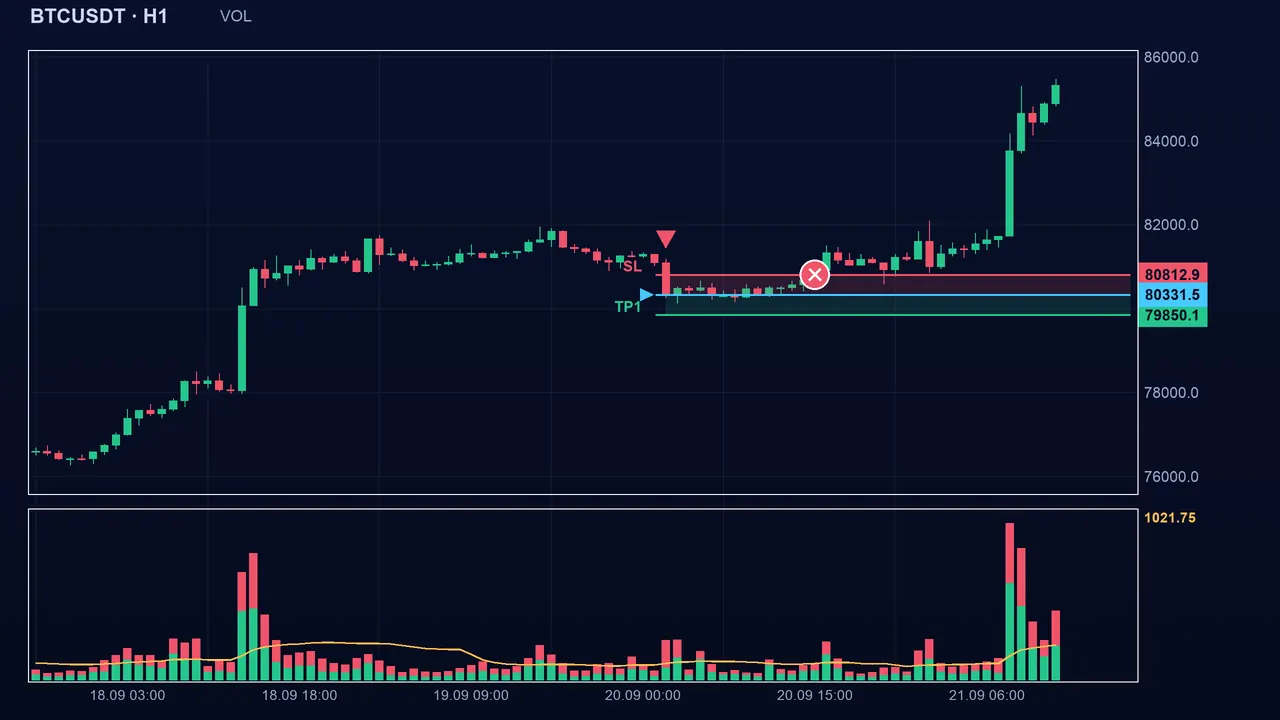
Key takeaways
- A volume spike is a candle whose volume is at least 2 times the 20-candle average (current candle included).
- The direction is the candle’s: close above the open, buy; below, sell.
- The state lasts until the next spike in the opposite direction: it does not indicate a trend.
- On Deriv, volume is an estimate (candle height), not real volume.
📝 Lesson test
Log in to take this lesson’s test. Once you have passed all the tests, you will receive a certificate in your name.
Log inThese lessons are for understanding and are not investment advice. No method guarantees winning.