
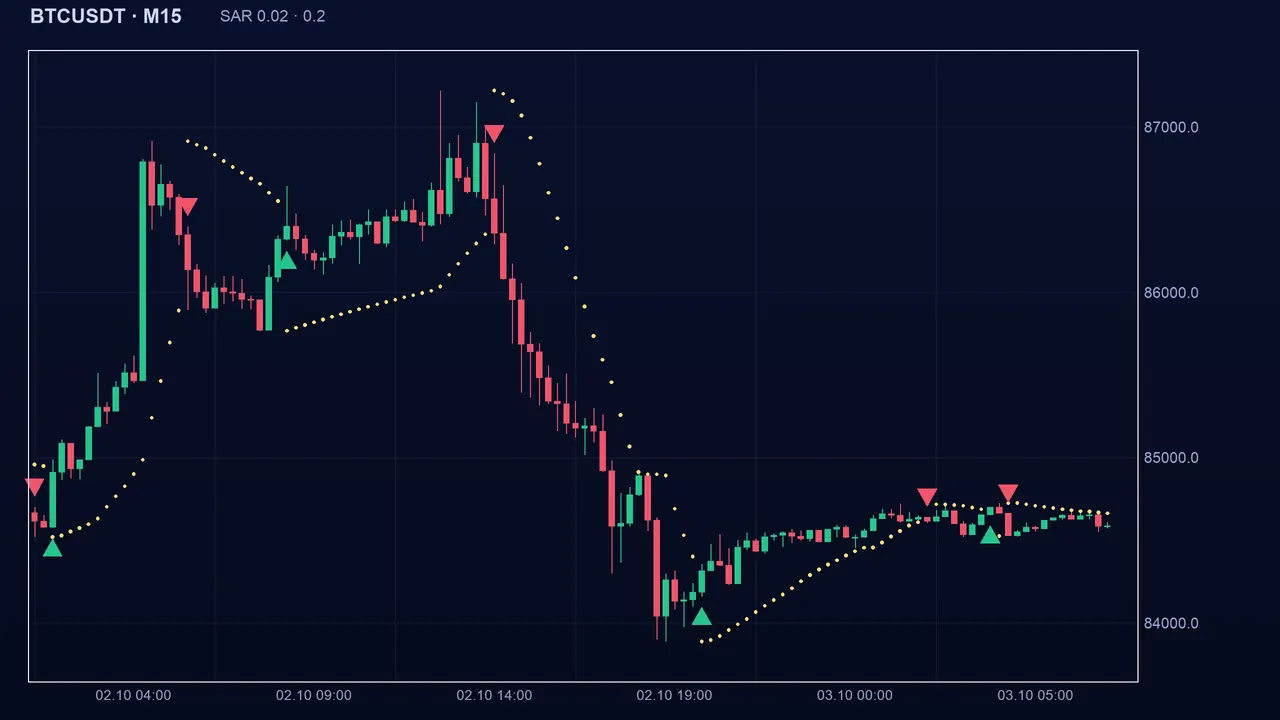
The Parabolic SAR (Parabolic Stop And Reverse, psar in Algo Signals) draws a series of dots below price in an uptrend and above it in a downtrend. The dots close in on price faster and faster, like a parabola, until price touches them.
What the Parabolic SAR is for
It is used to follow a trend and spot the moment it turns. The name “Stop And Reverse” says it: when price touches the dot, the position is reversed. Many traders also use it as a stop-loss that moves by itself.
How it is calculated
On each candle, the SAR dot moves toward the “extreme point” (EP), the highest reached in an uptrend or the lowest in a downtrend: next SAR = SAR + AF × (EP − SAR). AF is the acceleration factor: it starts at the step (0.02) and increases by the step on each new extreme point, without exceeding the cap (0.2). In an uptrend, the SAR cannot go above the lows of the two previous candles. When price touches the SAR, the trend reverses: the SAR takes the value of the old extreme point, the EP becomes the opposite extreme and the AF returns to the step. The state is +1 in an uptrend, −1 in a downtrend.
Reading the signal in Algo Signals
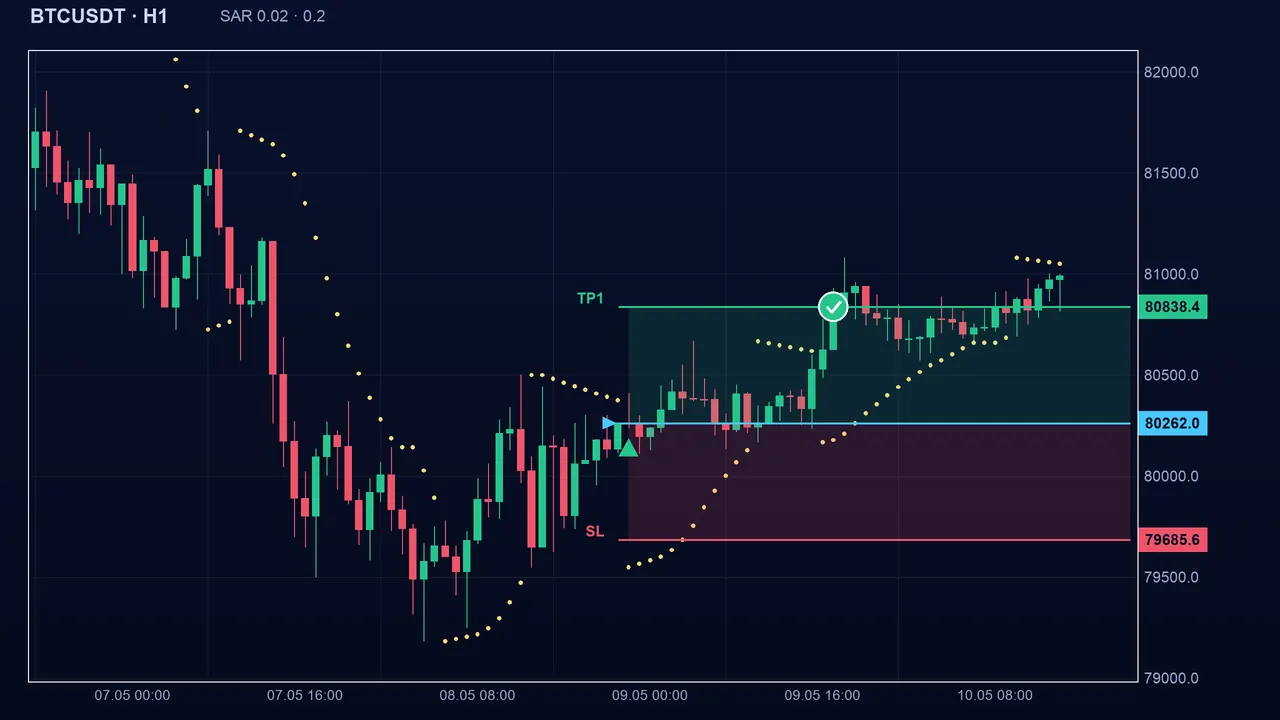
The buy signal appears when the state goes from bearish to bullish (the dots move below price), the sell signal the other way. The psar is one of Algo Signals’ “classic” indicators. The initial direction is deduced from the first two closes, so the very first states are not reliable.
The settings
- Step (step): 0.02 by default, adjustable from 0.001 to 1.0. Larger, the dots accelerate fast and hug price; smaller, they leave more room.
- Cap (max): 0.2 by default, adjustable from 0.01 to 2.0. It limits the maximum acceleration of the dots.
- Keep the cap greater than or equal to the step: otherwise the acceleration cannot work as intended.
- These values are common conventions, not optimal values.
The traps
In a sideways market, price keeps touching the dots: the SAR flips repeatedly and each flip is a signal opposite to the previous one. On Boom and Crash, a sudden spike hits the SAR in one go and the signal arrives after the jump.
Key takeaways
- The SAR is a series of dots accelerating toward price (step 0.02, cap 0.2).
- The signal is the dots flipping when price touches them.
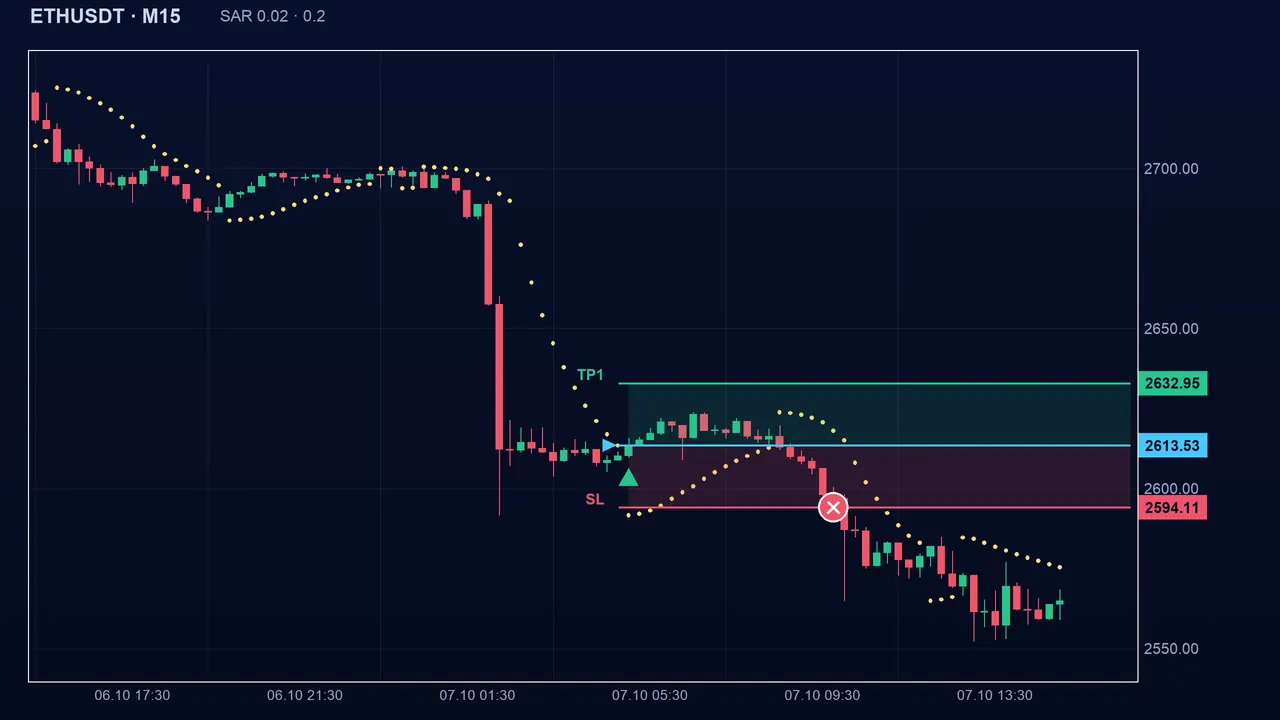
- It is built for trending markets; in a sideways market it strings together false signals.
- Pair it with the ADX to gauge trend strength, and always keep a stop-loss.
📝 Lesson test
Log in to take this lesson’s test. Once you have passed all the tests, you will receive a certificate in your name.
Log inThese lessons are for understanding and are not investment advice. No method guarantees winning.