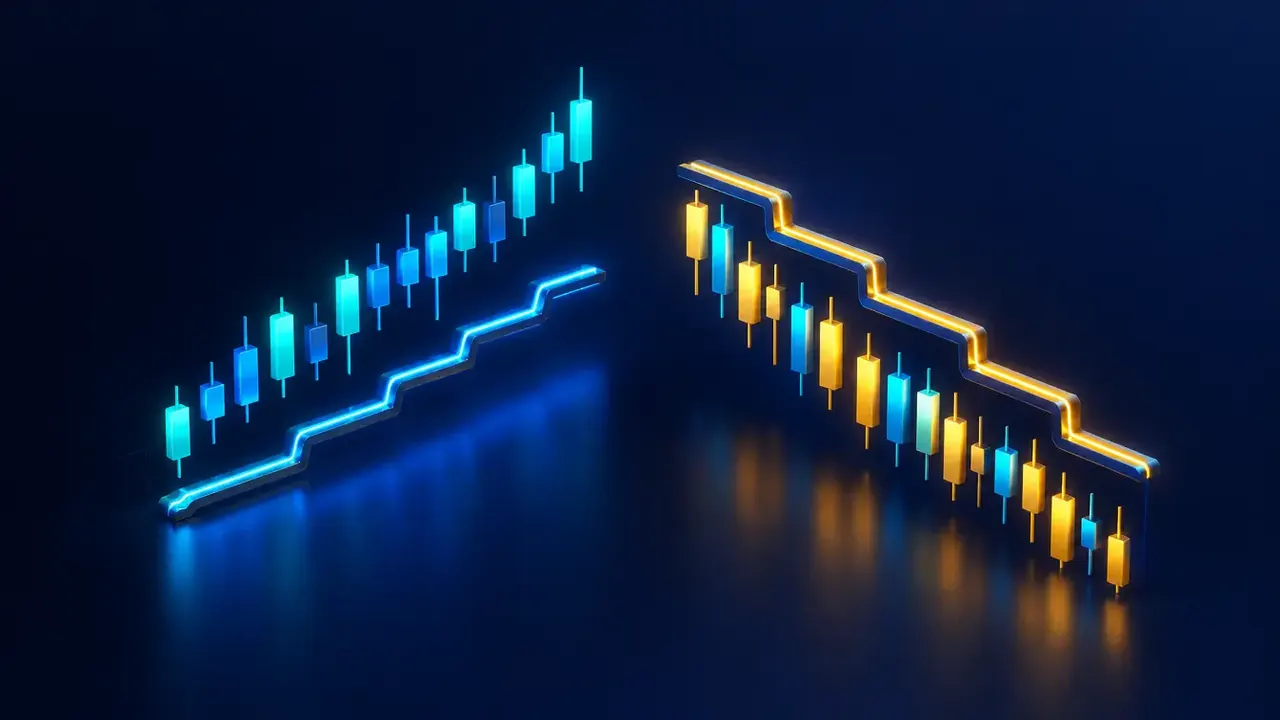
The SuperTrend is one of the most widely used indicators for following a trend. It draws a line that stays below price in an uptrend and above it in a downtrend. It is also one of the indicators ticked by default in Algo Signals.
What the SuperTrend is for
It answers two questions: which way is the trend going, and at what level should it be considered broken? The line serves as a reversal marker and, for many traders, as a protection level. It accounts for volatility through the ATR: the more the market moves, the wider the line sits.
How it is calculated
The ATR is computed over 10 candles (simple average of the true range). For each candle, two bands are built around the candle’s midpoint (high + low) ÷ 2: upper band = midpoint + 3 × ATR, lower band = midpoint − 3 × ATR. The “final” bands are adjusted to move in one direction only: the lower one does not fall while the trend is up, the upper one does not rise while it is down. The trend turns bearish when the close falls below the previous final lower band, and bullish when it rises above the previous final upper band.
Reading the signal in Algo Signals
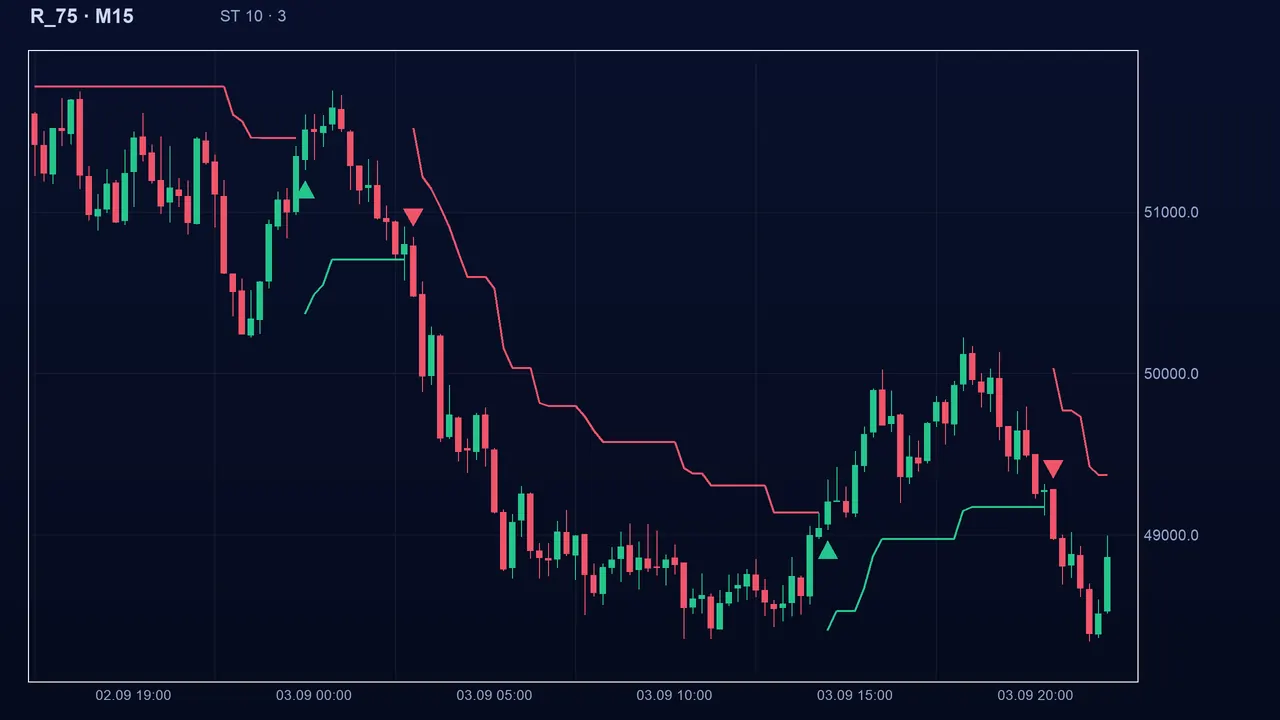
The state is bullish or bearish (neutral while the ATR cannot be computed). The buy signal appears when the state goes from bearish to bullish, the sell signal the other way. The SuperTrend is part of the starting selection with macross, macd, ma100 and ma200. Algo Signals can also use it as a higher-timeframe filter.
The settings
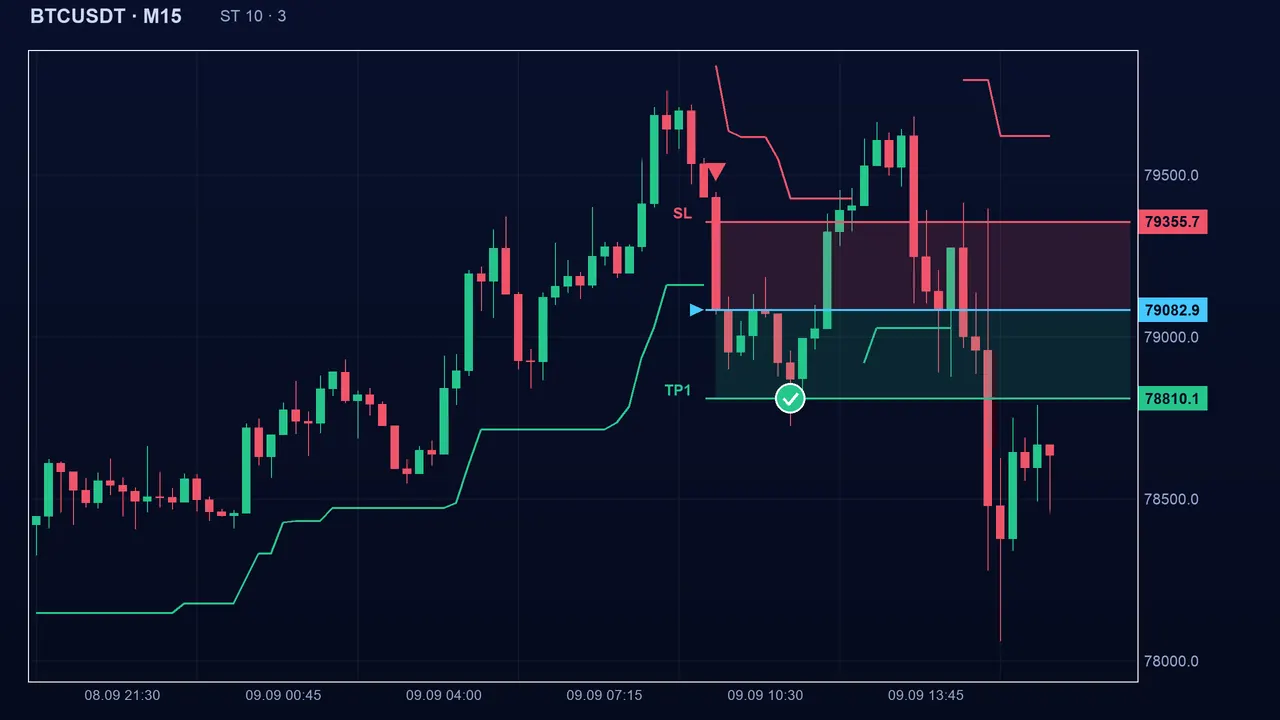
- ATR period (atrPeriod): 10 by default, adjustable from 1 to 100. Shorter, the line follows price more closely.
- Multiplier (mult): 3 by default, adjustable from 0.1 to 20. Smaller, the line is tight and triggers fast; larger, it lets price breathe but reacts late.
- These values are common conventions, not optimal values: a setting that shines on the past is often just a fit to history.
The traps
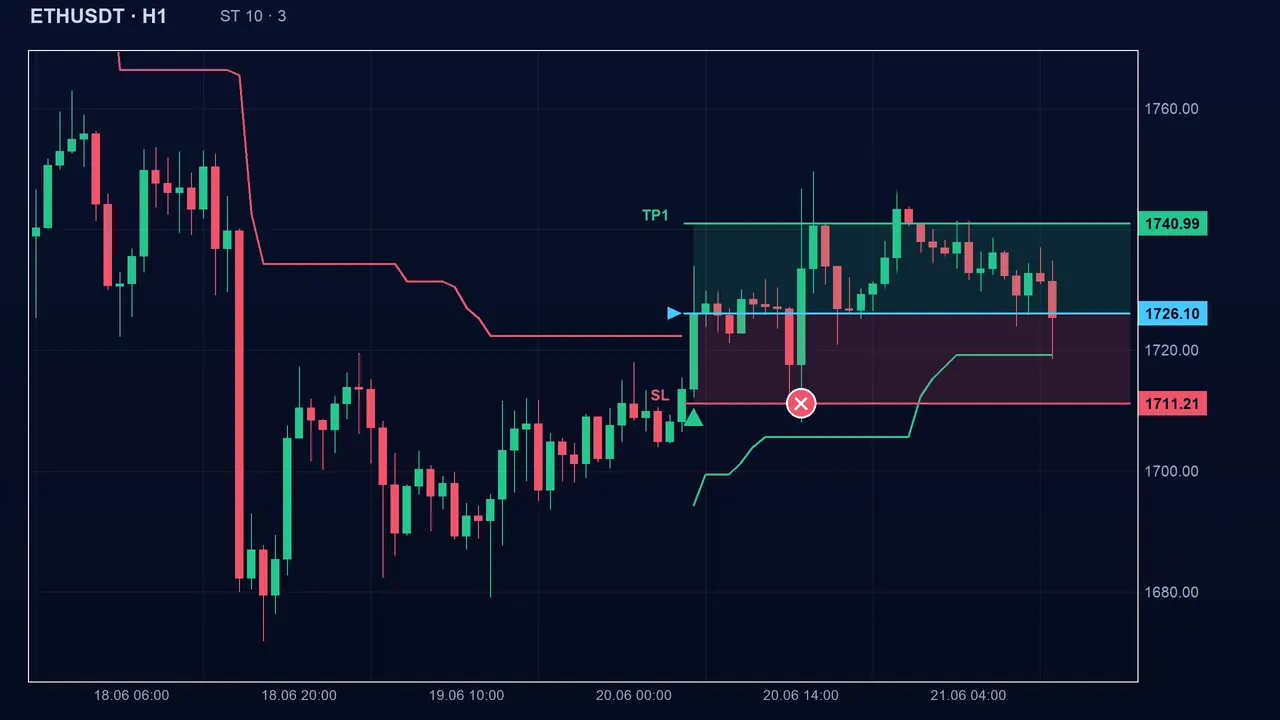
In a market with no trend, price crosses the line in both directions: every crossing is a signal and the loss is paid each time. A small multiplier worsens this, a large one lengthens the lag.
Key takeaways
- The line sits 3 × the ATR (period 10) from the candle midpoint and does not retreat in the trend’s direction.
- The signal is the close crossing the previous final band; it is slow but clear.
- In a sideways market, reversals chain together and cost small losses.
- Pair it with the ADX to check the market has direction, and do not follow it blindly.
📝 Lesson test
Log in to take this lesson’s test. Once you have passed all the tests, you will receive a certificate in your name.
Log inThese lessons are for understanding and are not investment advice. No method guarantees winning.