
The most direct way to measure momentum is to ask: how much has the price moved over the last few candles? That is what the ROC (Rate Of Change) does: it gives the price change as a percentage over a fixed period. Positive, the price rose; negative, it fell. It is the simplest momentum indicator, and it predicts nothing.
How it is calculated
Algo Signals compares the current close with the close 12 candles ago: ROC = (close ÷ close 12 candles ago − 1) × 100. The result is a percentage. The first 12 candles have no point of comparison: the state stays neutral.
- Close 12 candles ago: 100, current close: 103 → ROC = +3%.
- Close 12 candles ago: 100, current close: 98 → ROC = −2%.
- Only two closes matter: today’s and the one 12 candles ago. What happened in between does not change the result.
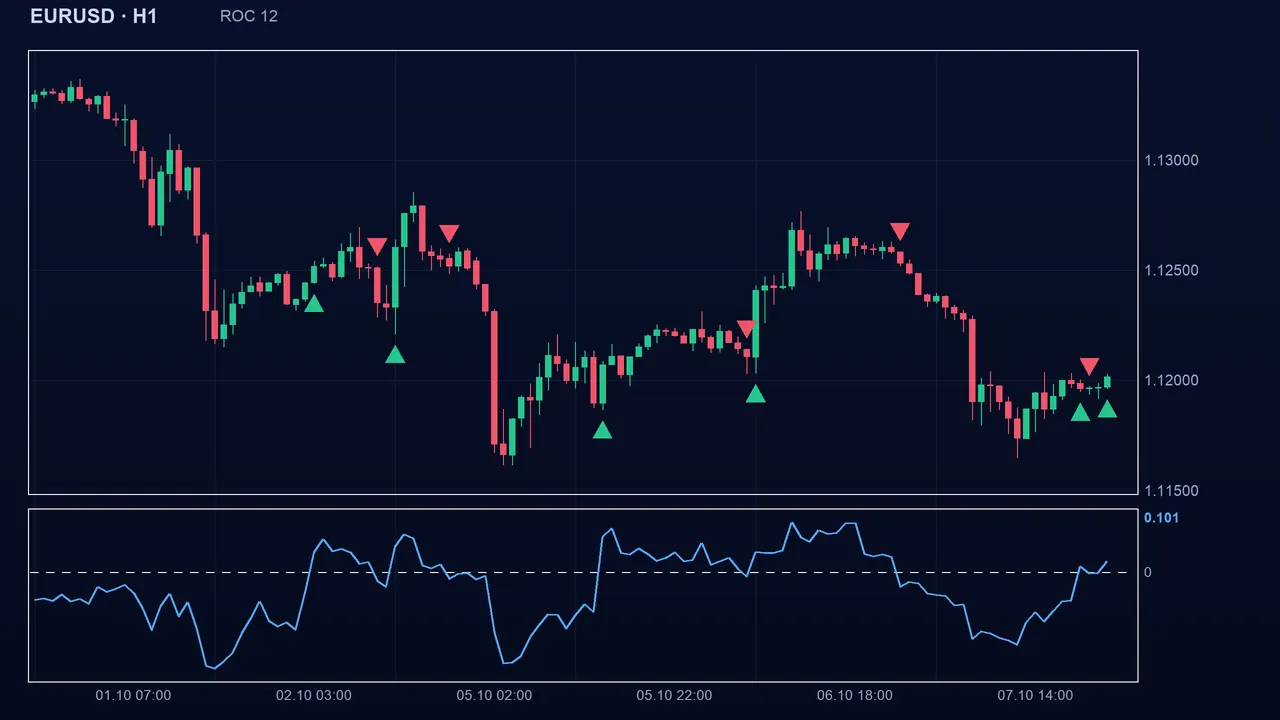
Reading the signal in Algo Signals
The “change threshold” setting (rocThr, in %) sets the bar. If the ROC is above the threshold, the state is bullish; if it is below the negative of the threshold, bearish; in between, neutral. The state is recomputed on every candle and is not held. With the default threshold of 0, any positive ROC is bullish and any negative one bearish.
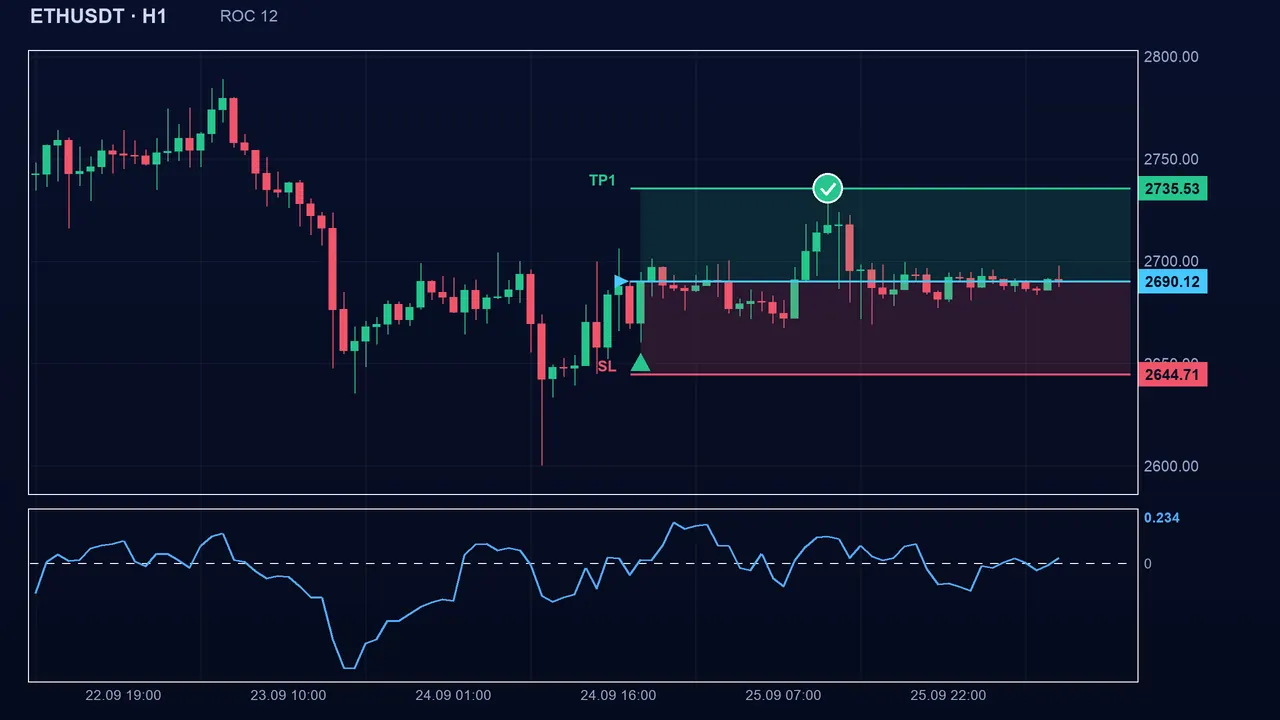
The settings
- Period (period): 12 by default (1 to 200). Shorter, the ROC reacts fast but moves more; longer, it is calmer and later.
- Threshold (rocThr): 0% by default (0 to 20). At 0 the ROC changes state at the slightest sign; a higher threshold keeps only marked moves and leaves the state neutral in between.
- The right threshold depends on the market and timeframe: 0.5% is huge on M1 for a currency pair, ordinary for an index on H4.
- These values are starting points, not proven optima.
The pitfalls
With the default threshold, the ROC flips as soon as the price moves a hair: in a flat market it strings signals together. Another quirk: since only two closes matter, one big candle pushes the ROC up for 12 candles, then, when it leaves the window, the ROC can drop at once although the price has not moved. On spike indices (Boom/Crash), a sudden spike produces exactly this effect.
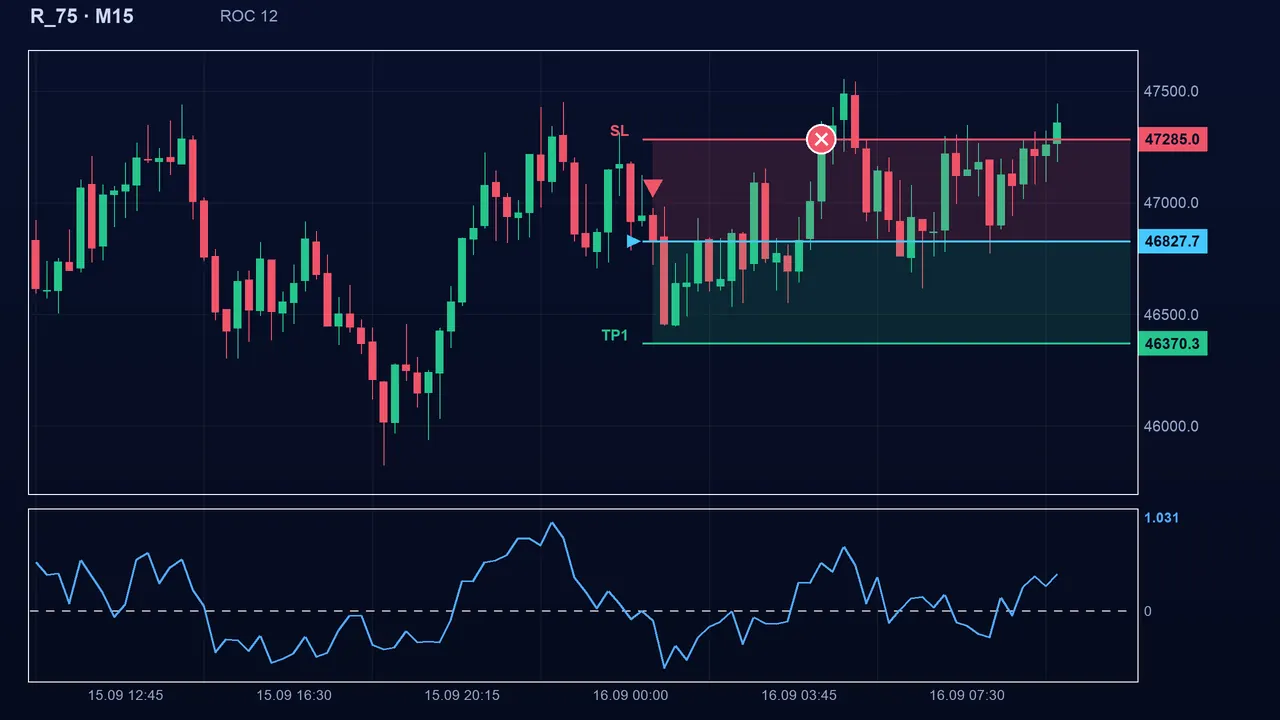
Key takeaways
- ROC = (close ÷ close 12 candles ago − 1) × 100, as a percentage.
- Bullish above the threshold, bearish below the negative of the threshold, neutral in between.
- At threshold 0 it is very sensitive to noise; at a higher threshold it keeps only marked moves.
- Combine it with a trend indicator (MA 200, ADX) or an oscillator (RSI) to require several confirmations.
📝 Lesson test
Log in to take this lesson’s test. Once you have passed all the tests, you will receive a certificate in your name.
Log inThese lessons are for understanding and are not investment advice. No method guarantees winning.