
To know whether a market’s momentum is rather bullish or bearish, you can compare what the price does very short term with what it does over the longer term. That is the principle of the Awesome Oscillator (AO): the difference between a short and a long average. Positive, the short term is above the long term; negative, it is below. It measures momentum, not a forecast.
How it is calculated
The AO does not start from the close but from each candle’s median price: (high + low) ÷ 2. Algo Signals computes the simple average of this median price over 5 candles (fast) and over 34 candles (slow). AO = 5-average − 34-average.
- Median price = (high + low) ÷ 2.
- AO > 0: the fast average is above the slow one. AO < 0: it is below.
- The first 34 candles lack history: the state stays neutral.
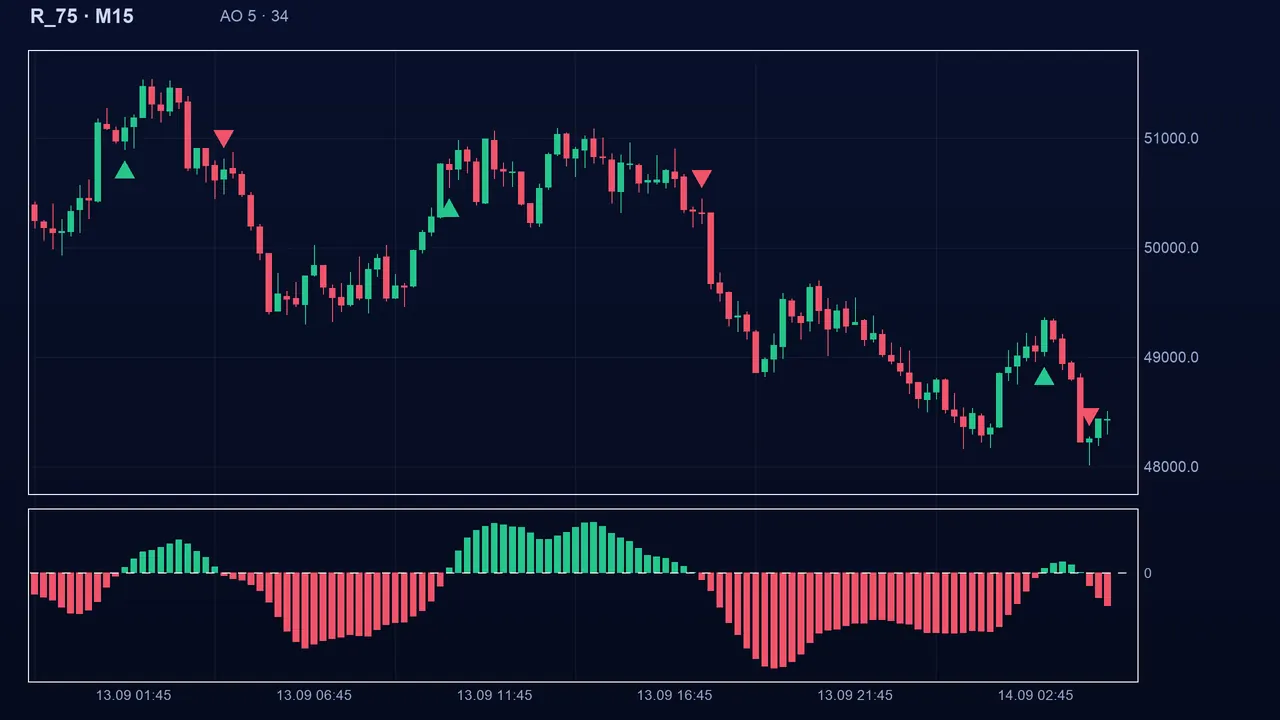
Reading the signal in Algo Signals
In Algo Signals the state is the sign of the AO: bullish when positive, bearish when negative. A buy signal appears when the AO goes from negative to positive (the 5-average crosses above the 34-average), a sell signal in the other direction. The patterns some traders look for on the histogram (“saucer”, “twin peaks”) are not used by Algo Signals.
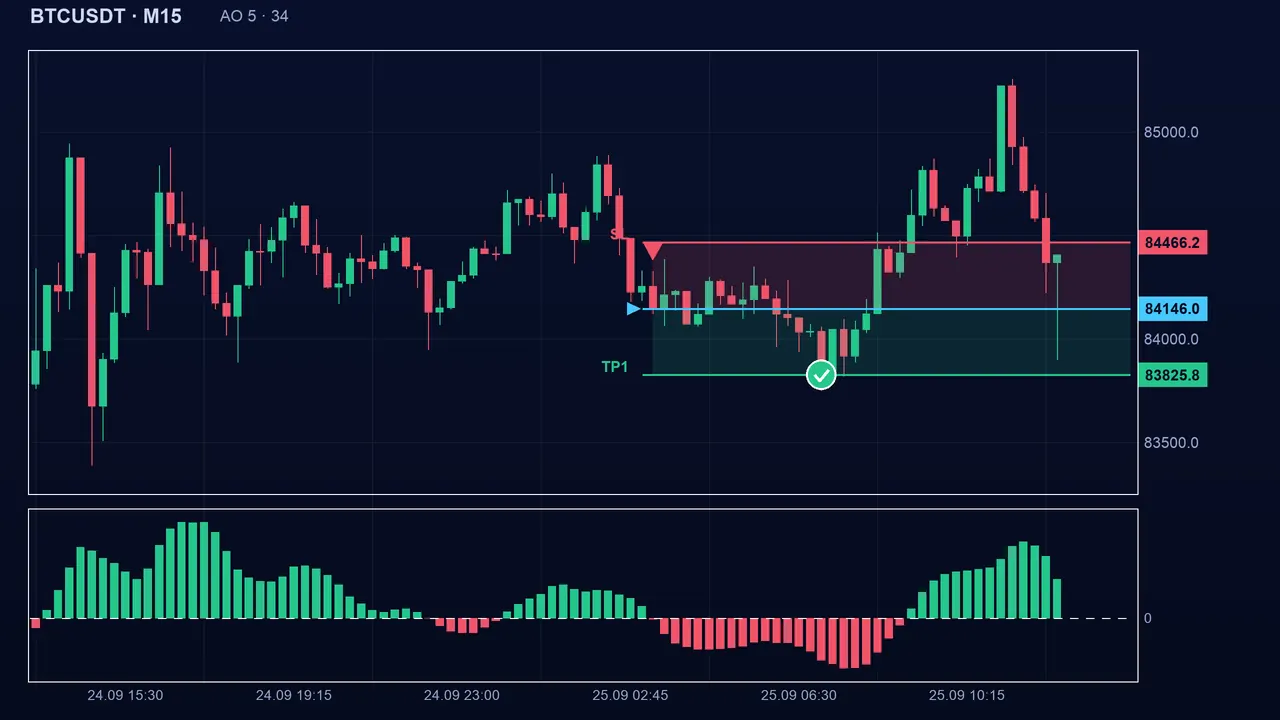
The settings
- Fast (fast): 5 by default (1 to 100). Shorter, the AO reacts faster but changes sign more often.
- Slow (slow): 34 by default (2 to 300). Longer, it follows wider moves, with more lag.
- 5 and 34 are the indicator’s classic values, not proven optima.
- Tuning the periods to “fit” history gives settings that do not repeat.
The pitfalls
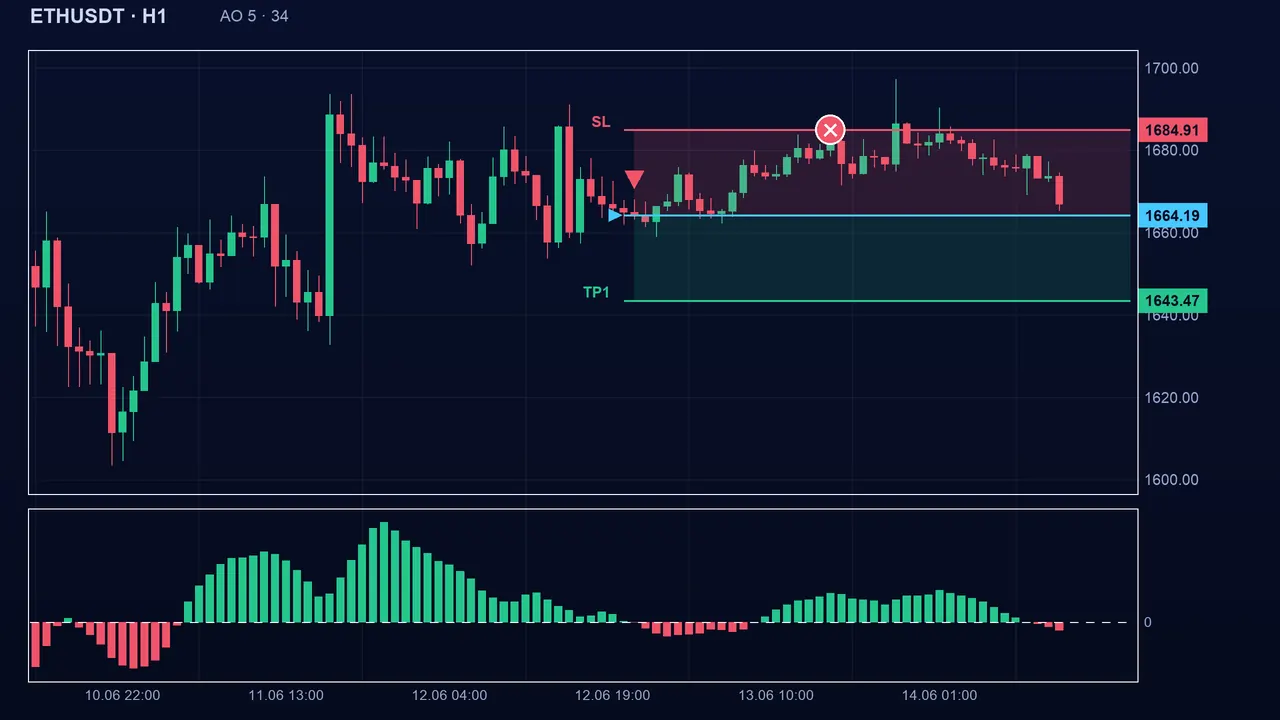
The AO is late by construction: the fast average has to pass the slow one, so the move has already started. In a flat market the two averages keep intertwining: the AO changes sign repeatedly and signals string together small losses. On spike indices (Boom/Crash), a sudden spike pulls the short average sharply and causes a sign change with no follow-through.
Key takeaways
- AO = 5-average − 34-average of the median price (high + low) ÷ 2.
- Buy when the AO crosses above zero, sell when it crosses below; the histogram patterns are not used.
- It confirms with a delay and gets lost in a flat market.
- Combine it with a trend filter (ADX, MA 200) or an oscillator (RSI) to require several confirmations.
📝 Lesson test
Log in to take this lesson’s test. Once you have passed all the tests, you will receive a certificate in your name.
Log inThese lessons are for understanding and are not investment advice. No method guarantees winning.