
On MetaTrader 5, some traders place an oscillator on a line (an average, a MACD, a cloud): the line is then rescaled to a fixed scale, between its recent low and recent high. Algo Signals reproduces this approach with five “0–100 scale” indicators: ma100n, ma200n, kumon, macdn and phantom. The principle is simple: a signal is born when the line touches the bottom or the top of its own range.
How the line is rescaled
We look at the last 330 values of the line (lookback). The lowest becomes 10, the highest becomes 90, and the others are placed in between: value = 10 + 80 × (v − low) ÷ (high − low). If the line is perfectly flat, the value is 50.
- ma100n and ma200n: smoothed moving average (SMMA) over 100 and 200 candles. First value = simple average, then (previous × (period − 1) + price) ÷ period.
- macdn: MACD = 12 exponential average − 26 exponential average.
- kumon: the two edges of the Ichimoku cloud (Senkou A and B, settings 5, 2, 52), not shifted, put in a common range with Tenkan and Kijun.
- Warm-up: for the averages and the MACD, no signal during the first candles (5 times the period, or 5 times the MACD’s slow period).
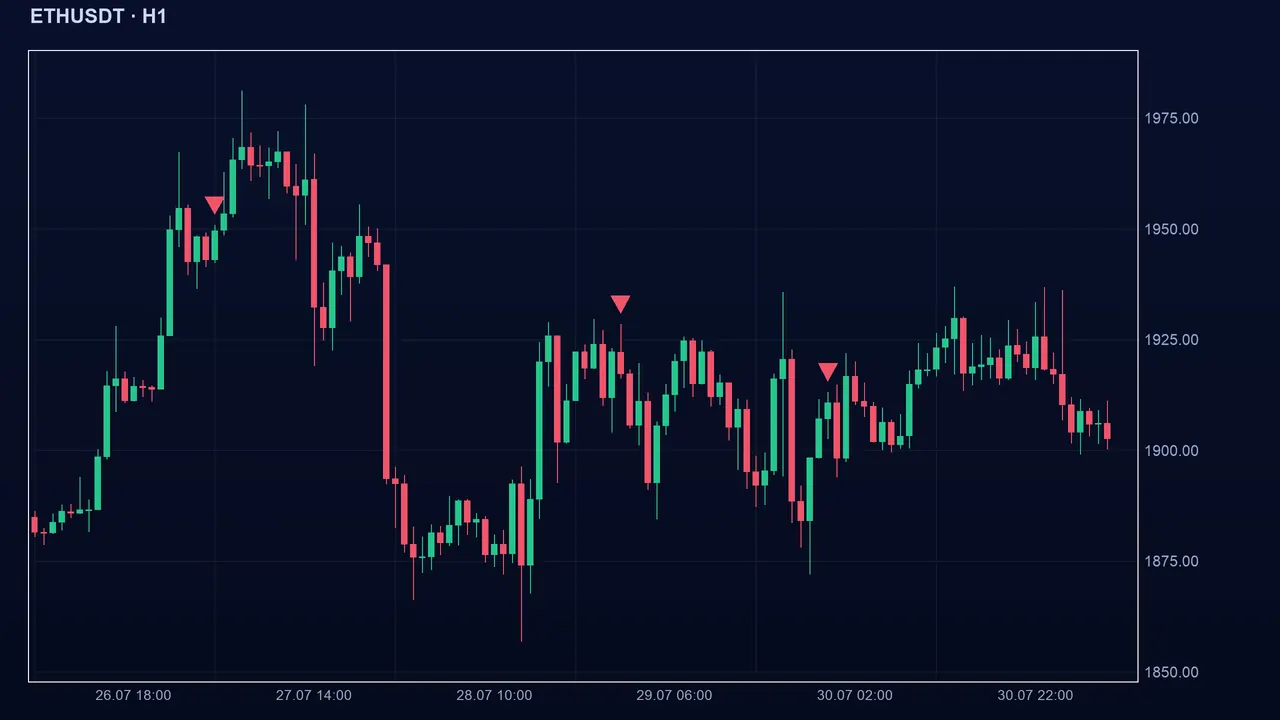
Reading the signal in Algo Signals
A buy appears when the rescaled line touches or goes below the low level (10.15 by default). A sell appears when it touches or exceeds the high level (89.85). In other words: the line is at its lowest of the last 330 candles (buy) or at its highest (sell). It is mean-reversion logic, betting that an extreme of the line will not last. With “repeat” (1 by default), each new touch gives a signal.
- kumon: in mode 1 (default), just one of the cloud’s two lines is enough; if one touches the bottom and the other the top, the signal is neutral. In mode 2, both must touch the same level.
- phantom: replica of an Expert Advisor. A smoothed average of 100 and one edge of the Kumo must each touch level 10 (buy) or 90 (sell), with a tolerance of 0.1 and values rounded to one decimal. In memory mode (entryMode 2), a touch is remembered until the average passes back through 50; one entry per cycle. In strict mode (1), everything must happen on the same candle.
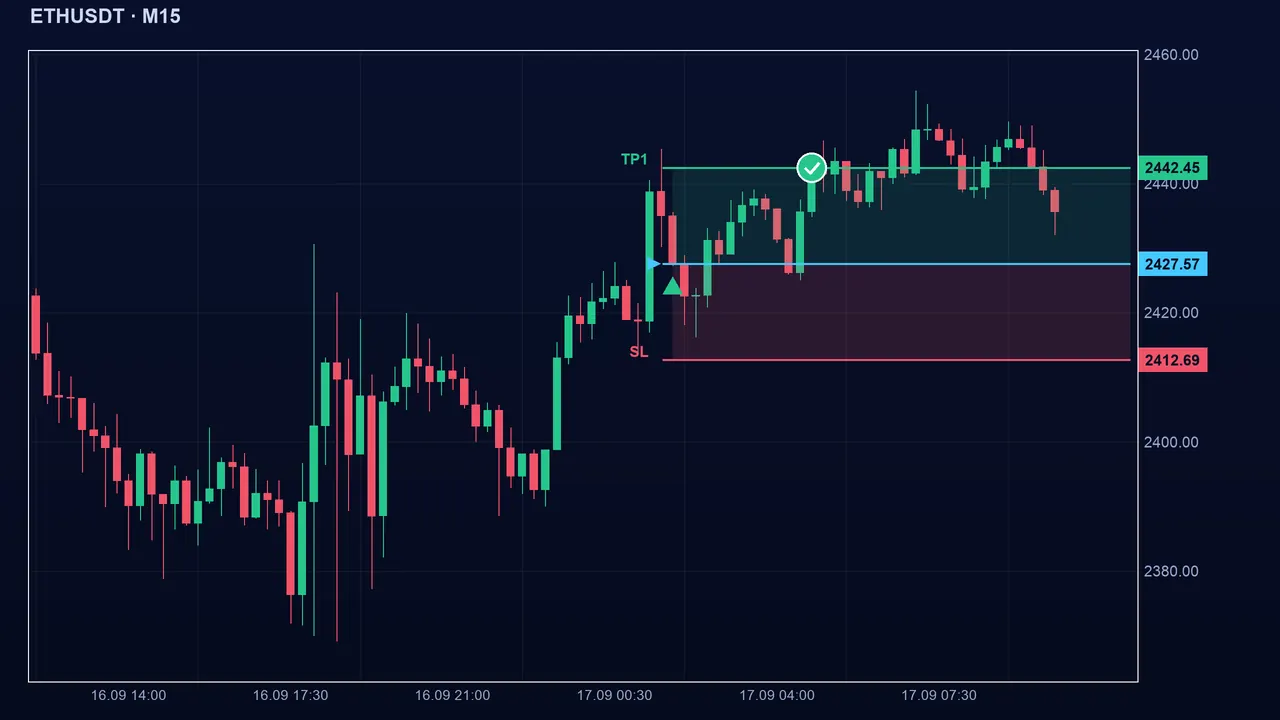
The settings
- Period (period: 100 for ma100n, 200 for ma200n, 100 for phantom); MACD fast 12 and slow 26; Kumo 5, 2, 52 (tenkan, kijun, senkou).
- Scale over (lookback, 330 candles): smaller, the line touches its extremes more often; larger, touches are rarer.
- Buy and sell levels (lowLvl 10.15 and highLvl 89.85; 10 and 90 for phantom): moving them closer to 50 gives more signals of lesser quality.
- scaleMode: 1 = sliding scale without repaint (default), 2 = window displayed like the MT5 screen. repeat: 1 = one signal at each new touch.
- phantom: tolerance (tol, 0.1), unlock level (resetLvl, 50), entry mode (entryMode, 2 = memory), optional second average (confirmOn, 0; confirmPeriod, 200).
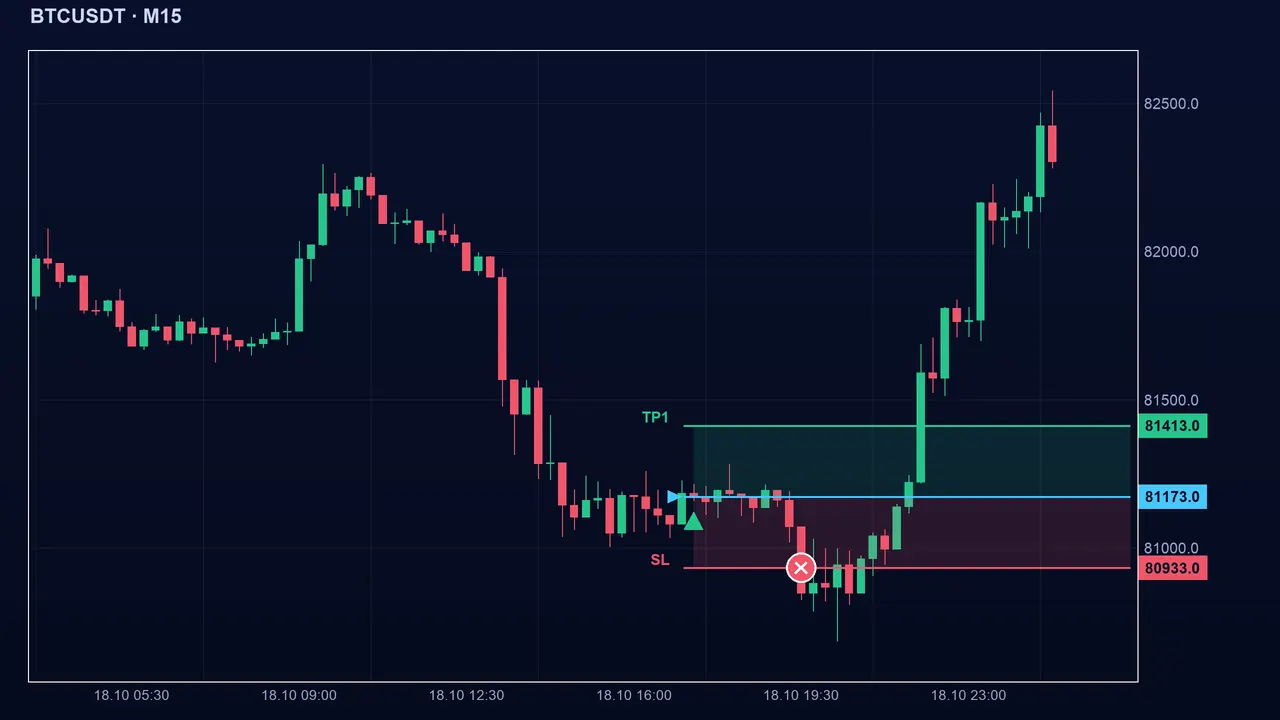
The pitfalls
Key takeaways
- The line is rescaled between 10 (its low over 330 candles) and 90 (its high).
- Buy: the line touches 10.15 or less; sell: 89.85 or more; phantom requires an average AND a Kumo edge.
- It is mean-reversion logic: it fails in lasting trends.
- Pair them with a trend indicator before entering, set the stop in advance and test on a demo account.
📝 Lesson test
Log in to take this lesson’s test. Once you have passed all the tests, you will receive a certificate in your name.
Log inThese lessons are for understanding and are not investment advice. No method guarantees winning.