
The classic RSI mostly looks for the 30 and 70 levels. The “RSI Trend Catcher” instead watches when the RSI crosses the 45 and 55 thresholds, to spot a trend resuming or a rebound taking hold. Algo Signals offers two indicators: rsitc_cont, for continuation, and rsitc_rev, for reversal.
How they are calculated
Both use the Wilder RSI over 14 candles. The RSI is sorted into three colours: bullish above 55 (tcUp), bearish below 45 (tcDn), neutral in between. rsitc_cont adds a 50-candle exponential average of price (tcEma). rsitc_rev also looks at the last 15 candles (revLook) and the 30 (osLvl) and 70 (obLvl) levels.
- rsitc_cont, buy: the previous candle’s RSI was neutral (between 45 and 55), the current RSI goes above 55, the close is above the 50-period exponential average and the candle is bullish (close above open). The sell is the mirror.
- rsitc_rev, buy: the RSI went below 30 at least once in the previous 15 candles, the previous candle was below 55, the current RSI is 55 or more, and the candle is bullish. The sell is the mirror with 70 and 45.
- A direct jump from below 45 to above 55 does not trigger rsitc_cont: the previous candle must be neutral.
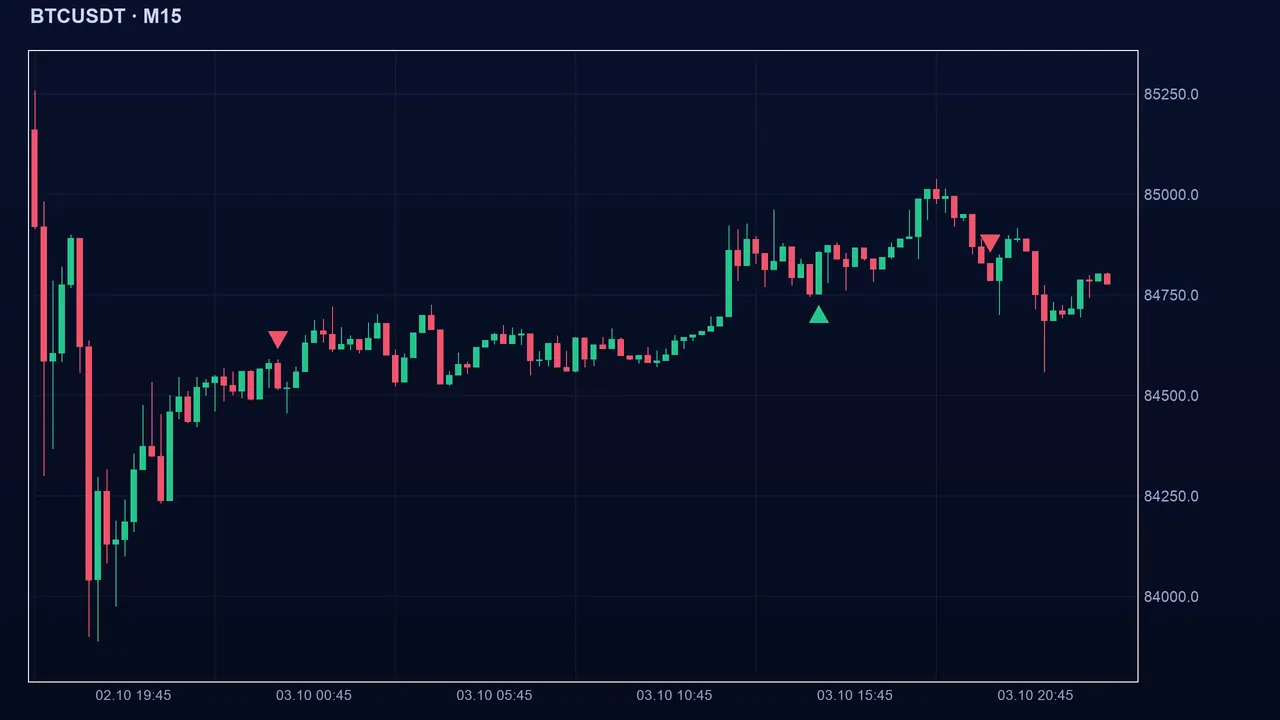
Reading the signal in Algo Signals
Both signals are one-offs: they exist only on the candle that meets all the conditions. rsitc_cont follows the trend after a pause; rsitc_rev bets that a rebound is taking hold after an oversold zone.
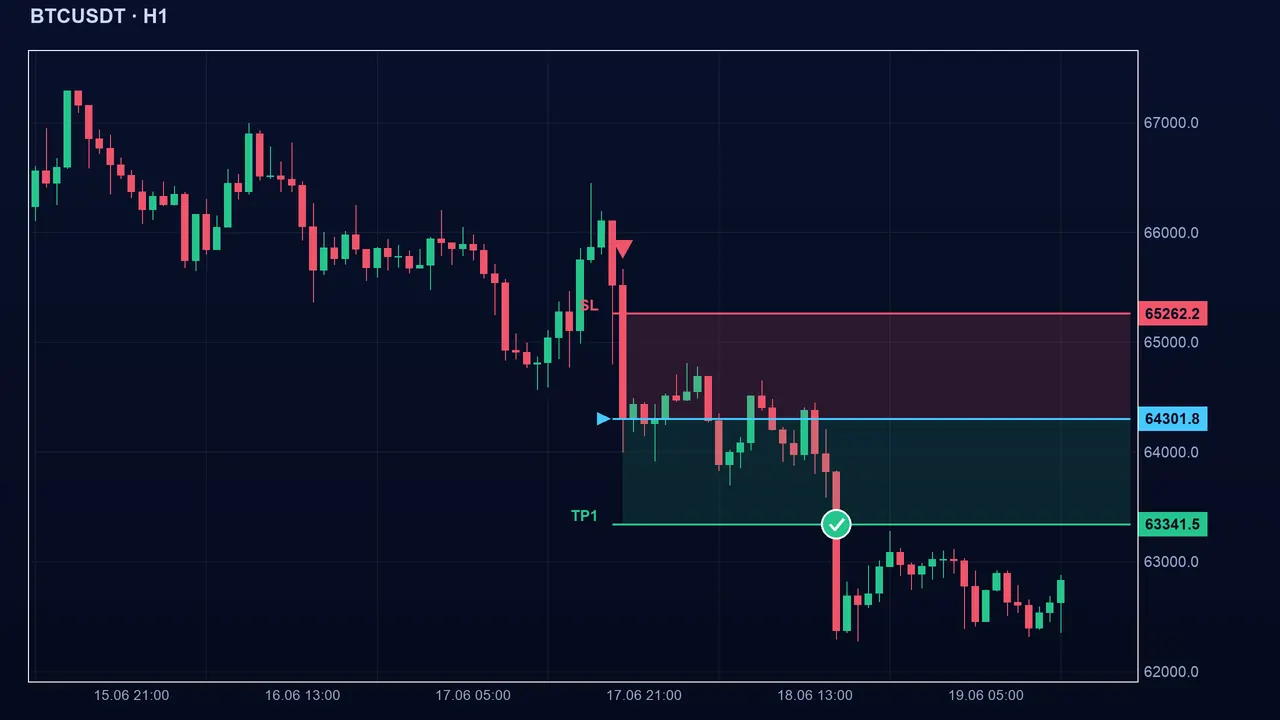
The settings
- RSI period (period, 14): smaller, the RSI reaches the thresholds more often, with more noise.
- Bullish and bearish thresholds (tcUp 55, tcDn 45): moving them closer to 50 gives more signals; moving them apart gives fewer.
- Trend exponential average (tcEma, 50), for rsitc_cont: longer, the trend filter is slower.
- Reversal: candles observed (revLook, 15), oversold (osLvl, 30) and overbought (obLvl, 70). Moving the levels closer to 50 gives more signals of lesser quality.
The pitfalls
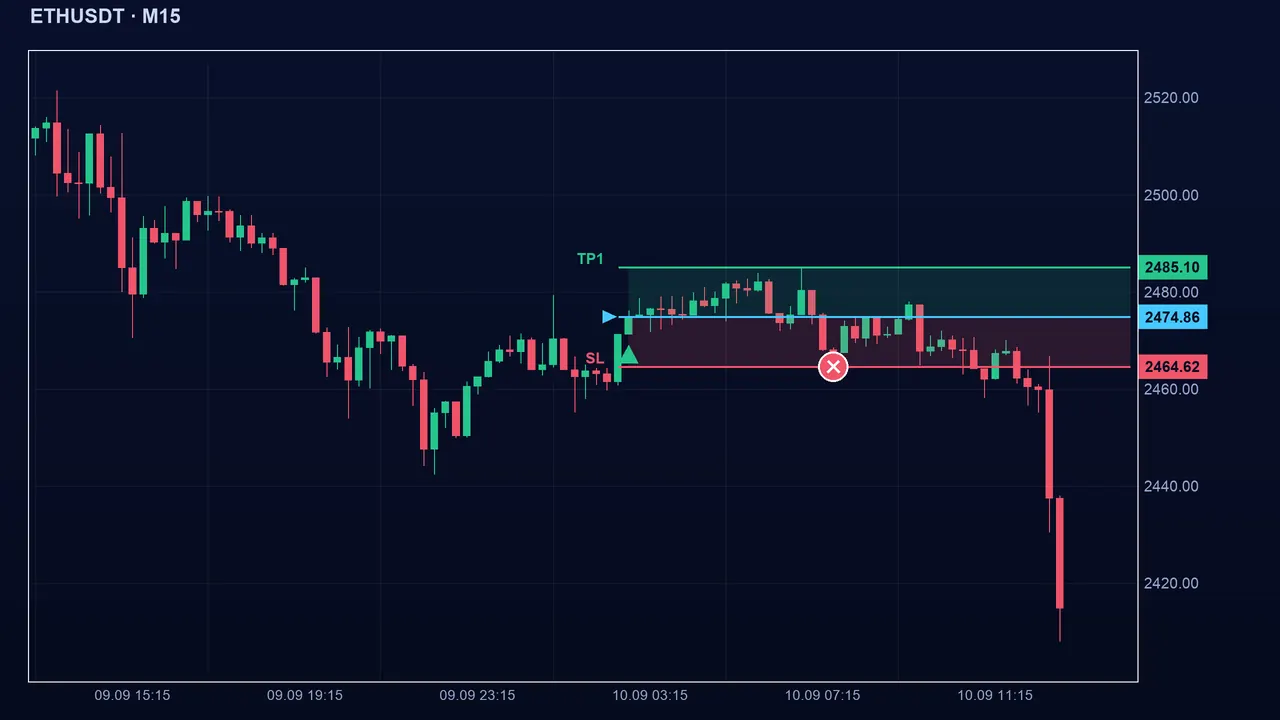
Key takeaways
- rsitc_cont: trend resuming, the RSI leaving the 45–55 neutral zone, with price on the right side of the 50 EMA and a candle in the same direction.
- rsitc_rev: rebound after an RSI that went below 30 (or above 70) in the last 15 candles.
- Both are one-offs and can arrive late.
- Define the stop before entering and record your results in R.
📝 Lesson test
Log in to take this lesson’s test. Once you have passed all the tests, you will receive a certificate in your name.
Log inThese lessons are for understanding and are not investment advice. No method guarantees winning.