
What is SSL for?
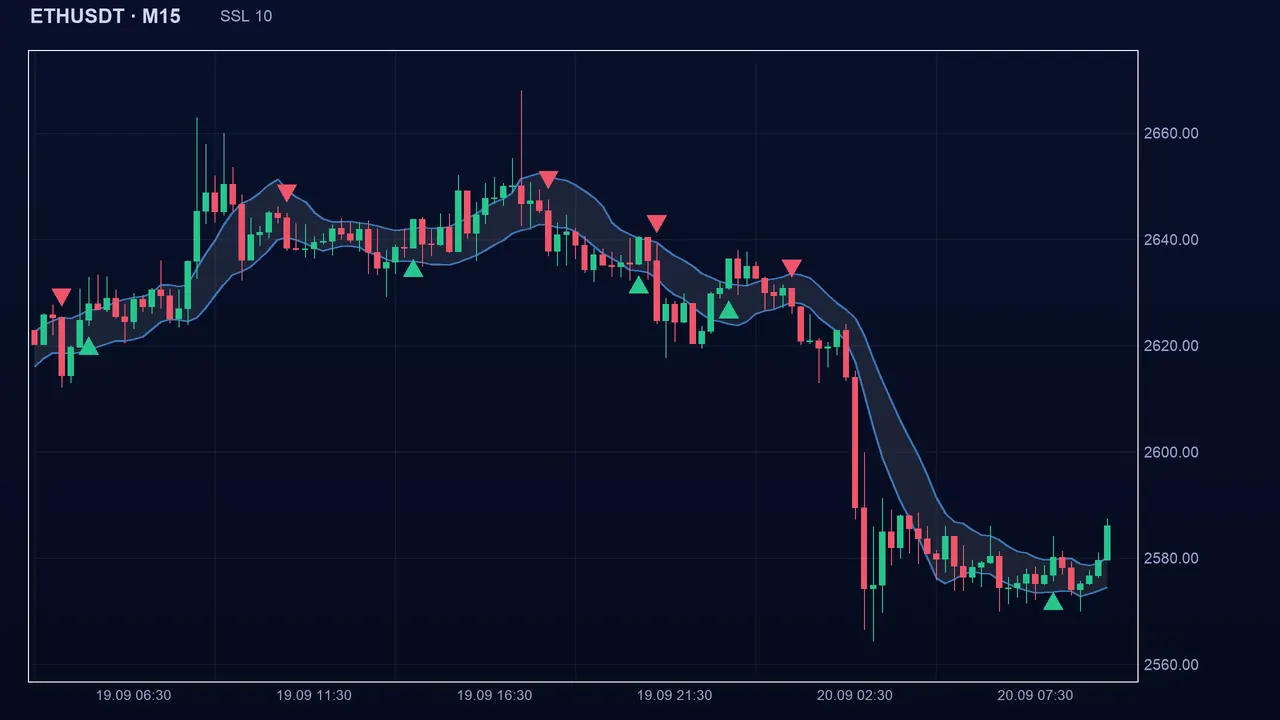
The SSL channel is a trend indicator popular in the online trading community. Instead of smoothing closes, it smooths the highs and the lows to form a small channel around price. As long as price stays inside, nothing changes. When the close leaves the channel, one side is considered to have taken over: buyers when it exits through the top, sellers when it exits through the bottom. The result is a simple indicator that keeps its position until an opposite signal appears.
How it is calculated
- SSL High = simple average of the highs of the last 10 candles. SSL Low = simple average of the lows of the last 10 candles.
- The High is above the Low: together they form a channel. The longer the candles, the wider the channel.
- State: if the close goes above the High, the state becomes bullish; if the close goes below the Low, the state becomes bearish; in between, the previous state is kept.
- Nothing is computed with the future, so the signal does not repaint. Until 10 candles exist, or before the first exit from the channel, the state is neutral.
Reading the signal in Algo Signals
The buy signal appears on the candle where the state turns bullish, that is, when the close goes above the SSL High. The sell signal appears when the close goes below the SSL Low. Between two exits from the channel, the indicator keeps “voting” the same way: if you combine several indicators, SSL therefore counts as a buyer or a seller until price crosses the channel the other way.
The settings
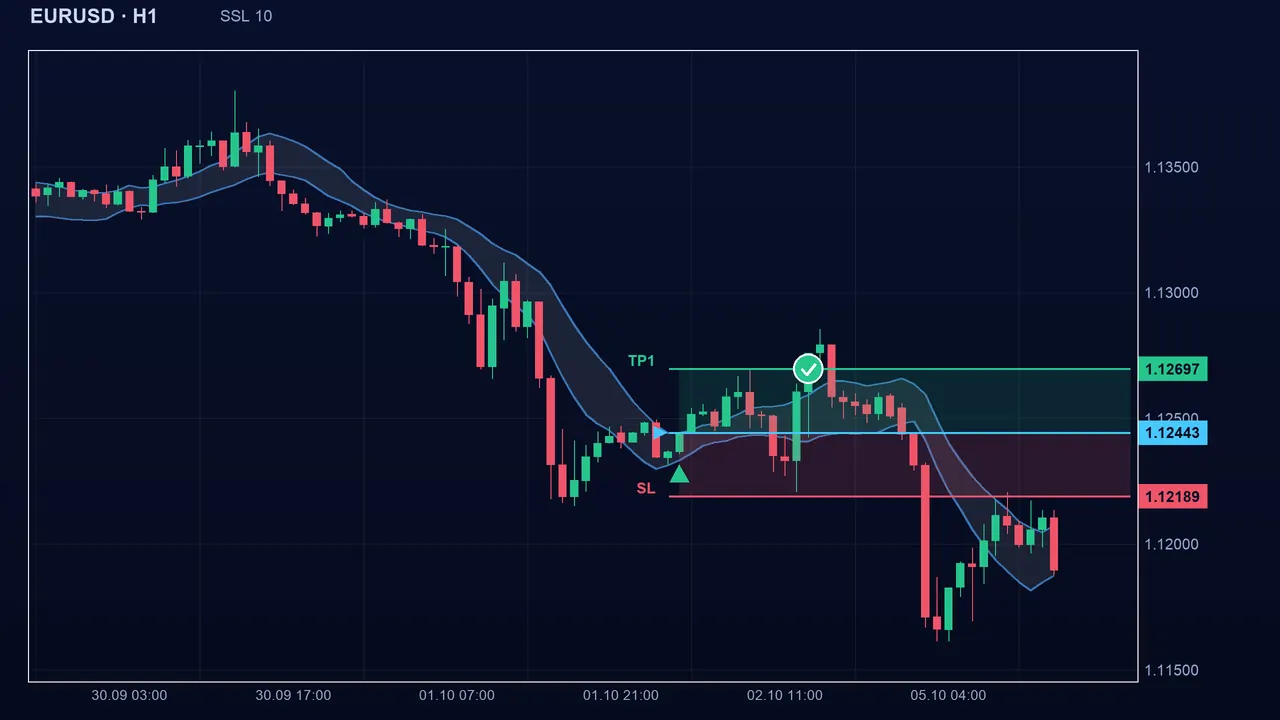
- Period: 10 by default (2 to 200). It is SSL’s only setting.
- Shorter: the channel is narrow and hugs price, it is crossed very often, with many signals and many false ones.
- Longer: the channel is wider and steadier, exits are rarer, but the signal comes later in the move.
- The value 10 is a convention: adapt it to your timeframe by testing on a demo account.
The pitfalls
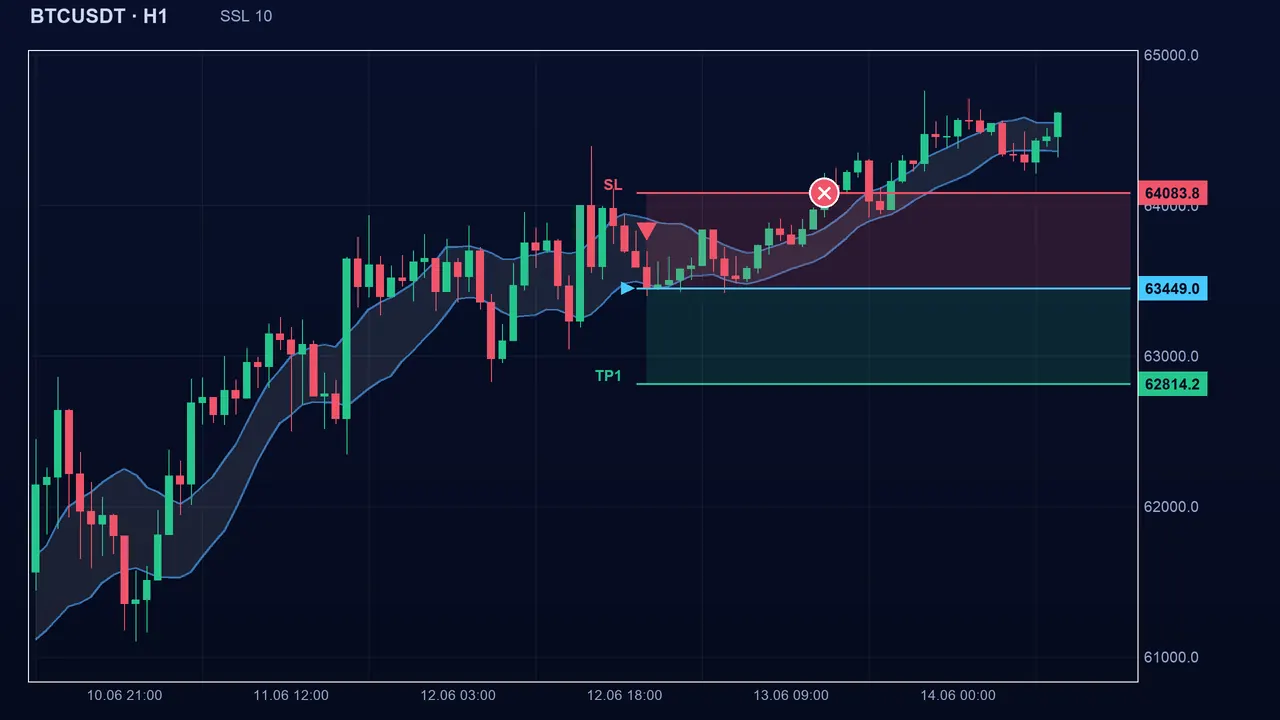
When the channel is narrow, for example after a quiet period, a close a few pips away is enough to leave it, and price can exit the other side a few candles later: SSL then strings together flips. In a market with no direction, this is its weak point. Because it keeps its state between two exits, it can also look “bullish” long after the trend has run out of steam. On Boom/Crash, a spike crosses the channel at once and flips the state, even if price comes straight back.
Key takeaways
- SSL draws a channel from the averages of highs and lows over 10 candles.
- Close above the High: bullish. Close below the Low: bearish. In between: the previous state is kept.
- It keeps its state, which makes it useful as a direction filter, but it strings together false signals when the channel is narrow and the market has no direction.
- Default setting: period 10.
📝 Lesson test
Log in to take this lesson’s test. Once you have passed all the tests, you will receive a certificate in your name.
Log inThese lessons are for understanding and are not investment advice. No method guarantees winning.