
What is the “Strong trend” indicator for?
A fast average above a slow one points to an uptrend, but it can be a soft, almost flat trend that offers little. Algo Signals’ “Strong trend” indicator adds two checks: the fast average must be rising quickly enough (its slope), and price must stay on the right side of that average. So it only flags trends that already have momentum.
How it is calculated
- Fast EMA (50 by default) and slow EMA (200 by default): two exponential averages of the closes.
- Slope = (current fast EMA − fast EMA from 10 candles ago) ÷ current fast EMA. A slope of 0.004 means a 0.4 % rise over 10 candles.
- Bullish if all three conditions are met: fast EMA above slow EMA, slope above the threshold (0.004), close above the fast EMA. Bearish: the mirror (slope below −0.004, close below the fast EMA). Otherwise neutral.
- Nothing is computed with the future, so the signal does not repaint. At least 200 candles are needed for the slow EMA to exist.
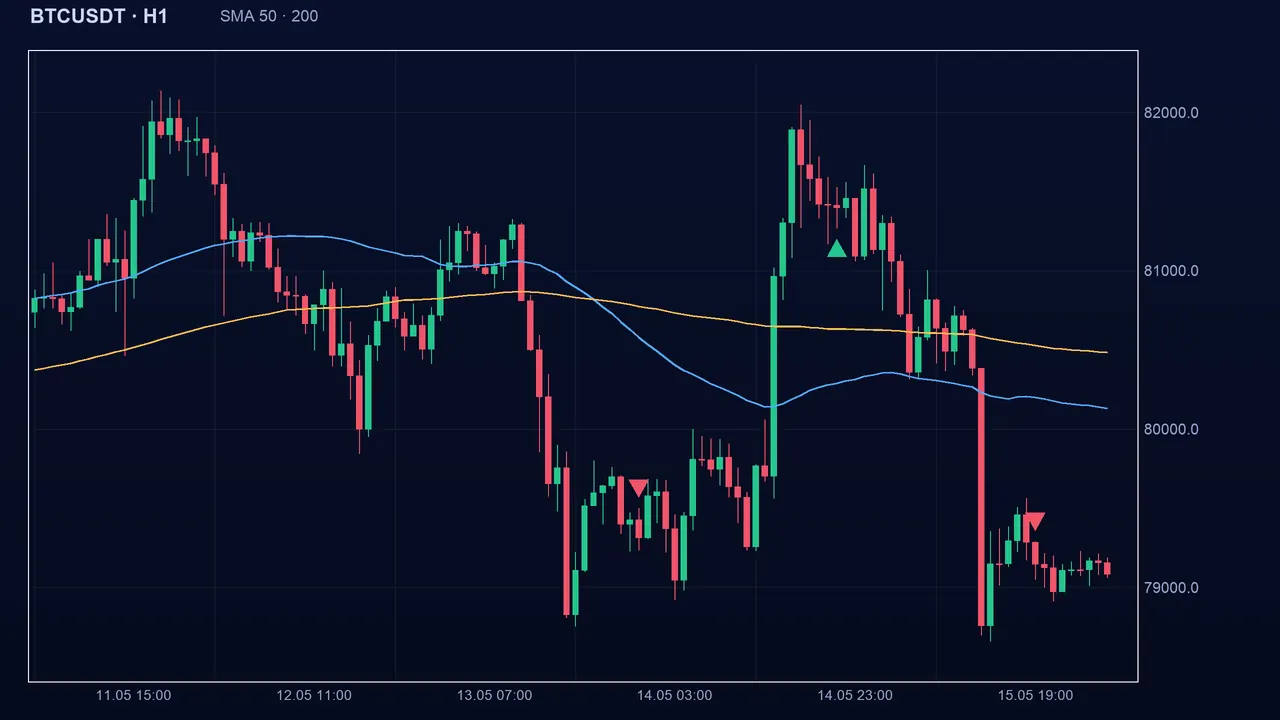
Reading the signal in Algo Signals
The state is bullish, bearish or neutral on every candle. The buy signal appears when the state turns bullish, the sell signal when it turns bearish. When one of the three conditions disappears, the state simply goes back to neutral without producing an opposite signal: the indicator tells you when a strong trend starts, not when it ends.
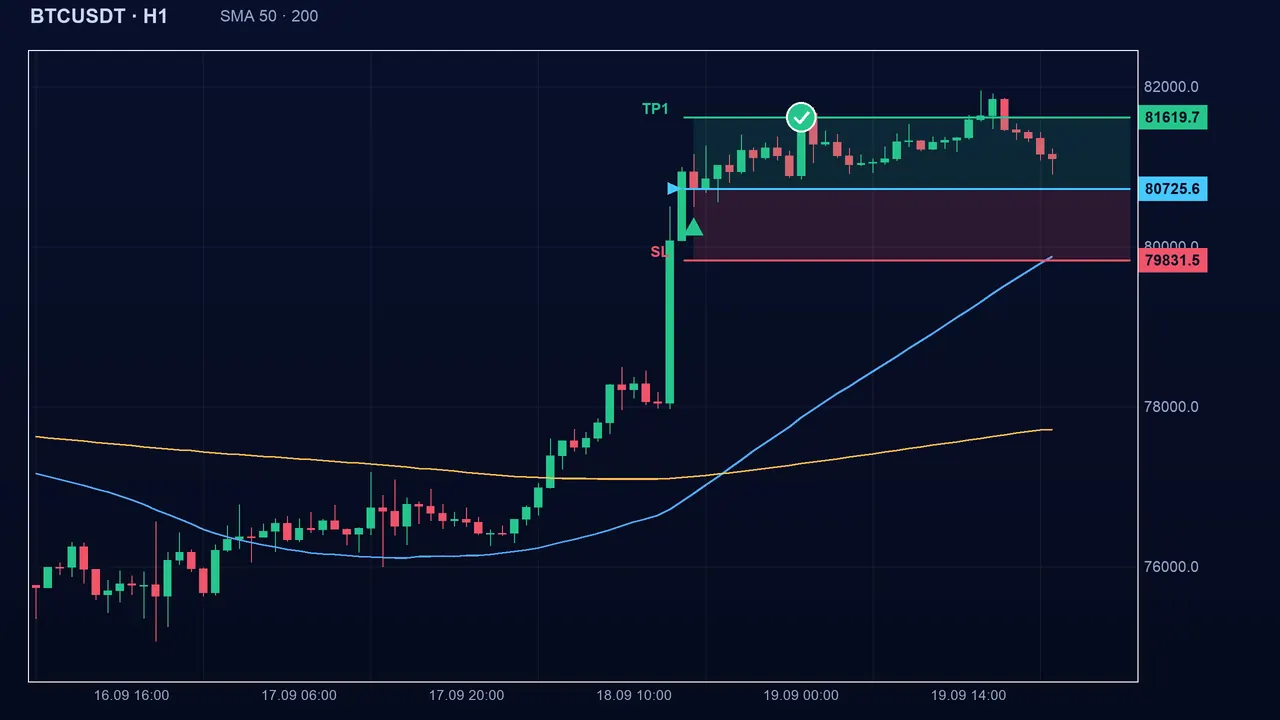
The settings
- Fast EMA: 50 by default (5 to 300). Slow EMA: 200 by default (20 to 1000). Shorter: the indicator reacts faster but accepts more fragile trends.
- Minimum slope: 0.004 by default (0.0005 to 0.05). Smaller: slow trends are accepted, so more signals. Larger: only very fast trends pass.
- Candles for the slope: 10 by default (2 to 100). The slope depends on the timeframe: 0.4 % in 10 candles is easy on a 1-hour chart and much rarer on 1 minute. Adapt the threshold.
The pitfalls
The indicator arrives late: the EMAs must be in place and the slope must already have built up, so part of the move is gone. It gives no exit signal: when the trend runs out of steam the state simply becomes neutral, and only your stop protects you. In a market that turns quickly, the slope can rise above the threshold and drop back within a few candles. On Boom/Crash, a spike makes the slope jump at once.
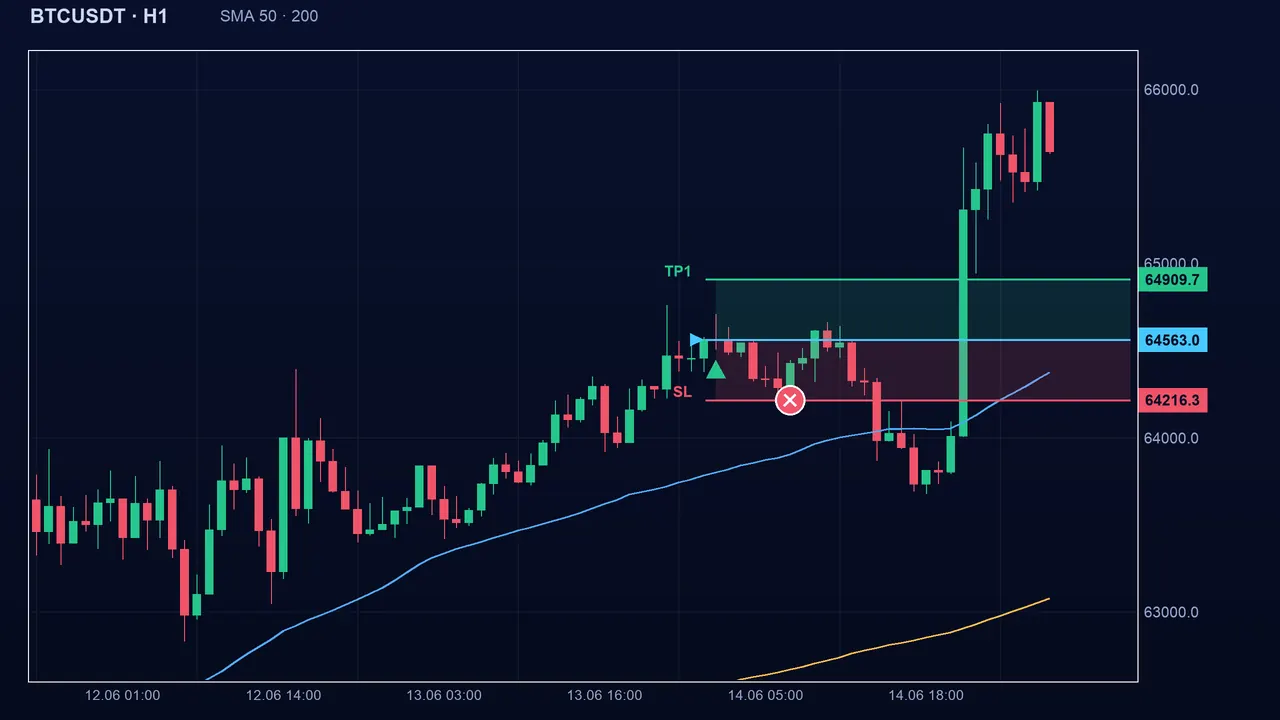
Key takeaways
- Buy: EMA 50 above EMA 200, slope above 0.004 over 10 candles, close above the EMA 50. Sell: the mirror.
- It looks for trends with momentum, not just a fast average above a slow one.
- It flags the start of a strong trend, never the exit: always plan a stop.
- Default settings: 50, 200, slope 0.004, 10 candles. Adapt the slope to the timeframe.
📝 Lesson test
Log in to take this lesson’s test. Once you have passed all the tests, you will receive a certificate in your name.
Log inThese lessons are for understanding and are not investment advice. No method guarantees winning.