
An oscillator is useful when it tells you whether price has gone “too far” from its average. WaveTrend turns that gap into a curve that rises and falls around zero. Algo Signals only takes into account crosses between two curves when we are in an extreme zone, where price is furthest from its average.
How it is calculated
The calculation has five steps. 1) Average price AP = (high + low + close) ÷ 3. 2) ESA = exponential average of AP over 10 candles. 3) D = exponential average of the distance |AP − ESA| over 10 candles. 4) CI = (AP − ESA) ÷ (0.015 × D). 5) WT1 = exponential average of CI over 21 candles, and WT2 = simple average of WT1 over 4 candles.
- CI compares the current gap with the usual gap. Calculation example: if AP is 1.2 above ESA and D is 0.8, then CI = 1.2 ÷ (0.015 × 0.8) = 1.2 ÷ 0.012 = 100.
- WT1 is the main curve, WT2 is its slower signal line.
- The 0.015 coefficient is the same as in the CCI: it puts the scale in a readable order of magnitude.
Reading the signal in Algo Signals
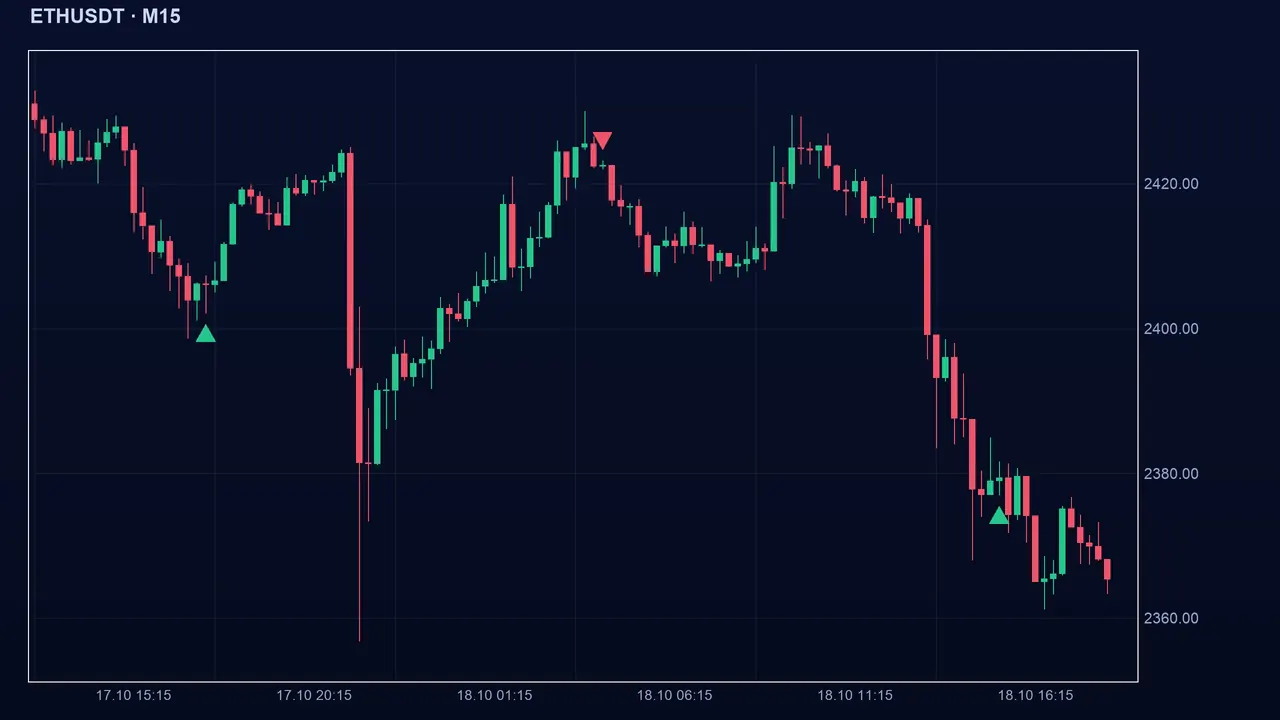
A buy appears when WT1 crosses up through WT2 while WT1 is below −40. A sell appears when WT1 crosses down through WT2 while WT1 is above +40. The signal is a one-off: it exists only on the candle of the cross. A cross that happens between −40 and +40 is ignored.
The settings
- Channel period (wtN1, 10): smoothing of the average and of the gap. Smaller, the curve reacts faster and becomes more nervous.
- Averaging period (wtN2, 21): smoothing of WT1. Larger, the curve is calmer but signals come later.
- Signal line (wtSig, 4): period of WT2. Smaller, WT2 hugs WT1 and crosses become more numerous.
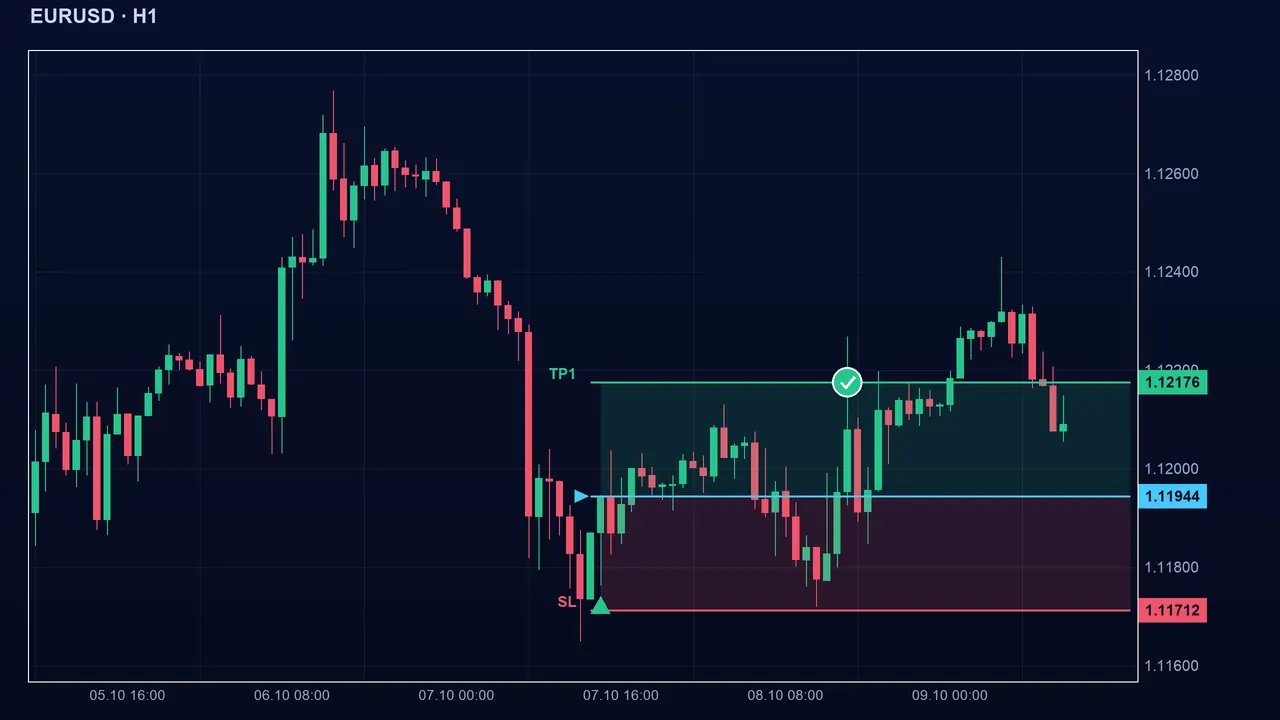
- Extreme level (wtLvl, 40): ± threshold. Higher (60), fewer signals but from more distant zones. Lower (20), more signals of lesser quality.
The pitfalls
Key takeaways
- WT1 is a smoothed curve of the gap between price and its average; WT2 is its signal line.
- Buy: cross up below −40. Sell: cross down above +40.
- One-off signal: only the cross in an extreme zone counts.
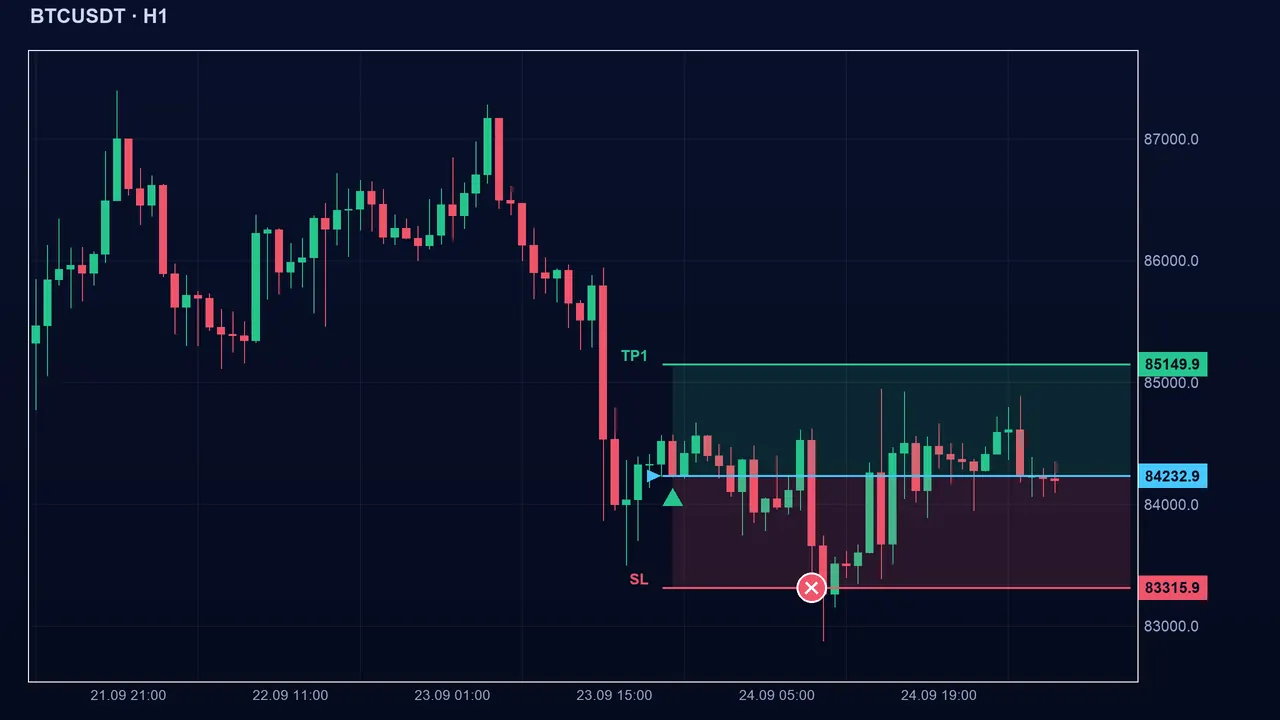
- It fails in strong trends: always use a stop.
📝 Lesson test
Log in to take this lesson’s test. Once you have passed all the tests, you will receive a certificate in your name.
Log inThese lessons are for understanding and are not investment advice. No method guarantees winning.