
Many oscillators jump from one candle to the next and give nervous signals. The TSI (True Strength Index) smooths price change twice to get a gentler curve showing whether rises or falls dominate. In Algo Signals it appears as “SMI Ergodic (TSI)” and is compared with its own signal line.
How it is calculated
Four steps. 1) The move m = close − previous close. 2) The numerator: exponential average of m over 25 candles (tsiLong), then exponential average of the result over 13 candles (tsiShort). 3) The denominator: the same double average, applied to the absolute value |m|. 4) TSI = 100 × numerator ÷ denominator. The signal line is the exponential average of the TSI over 7 candles (tsiSig).
- The TSI stays between −100 and +100: close to +100 when almost all smoothed moves are up, close to −100 when they are down.
- Calculation example: if the numerator is −0.12 and the denominator 1.60, then TSI = 100 × (−0.12) ÷ 1.60 = −7.5.
- For the signal line, the 7-candle exponential average gives a weight of 2 ÷ 8 = 0.25 to the new value and 0.75 to the line’s previous value.
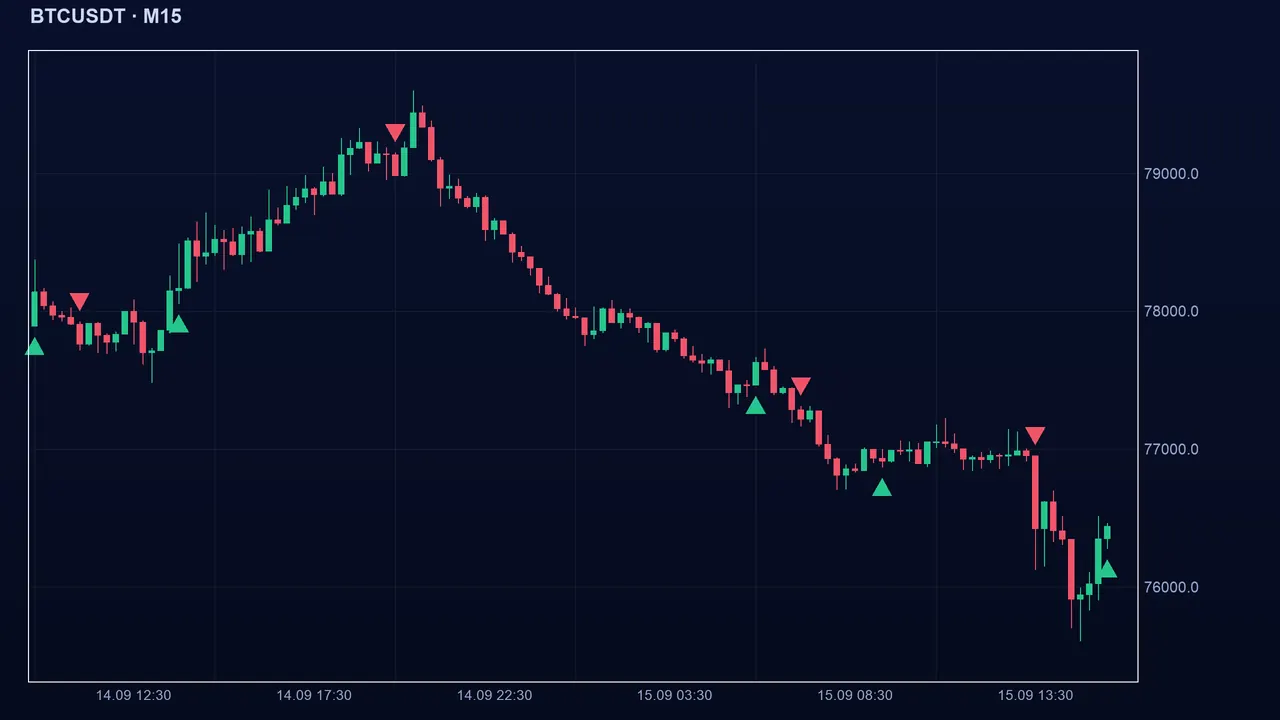
Reading the signal in Algo Signals
The state is bullish (+1) when the TSI is above its signal line, bearish (−1) when below, and neutral if they are equal. A signal appears when the state changes, that is, when the TSI crosses its signal line. Unlike WaveTrend, there is no zone filter: a cross counts even near zero.
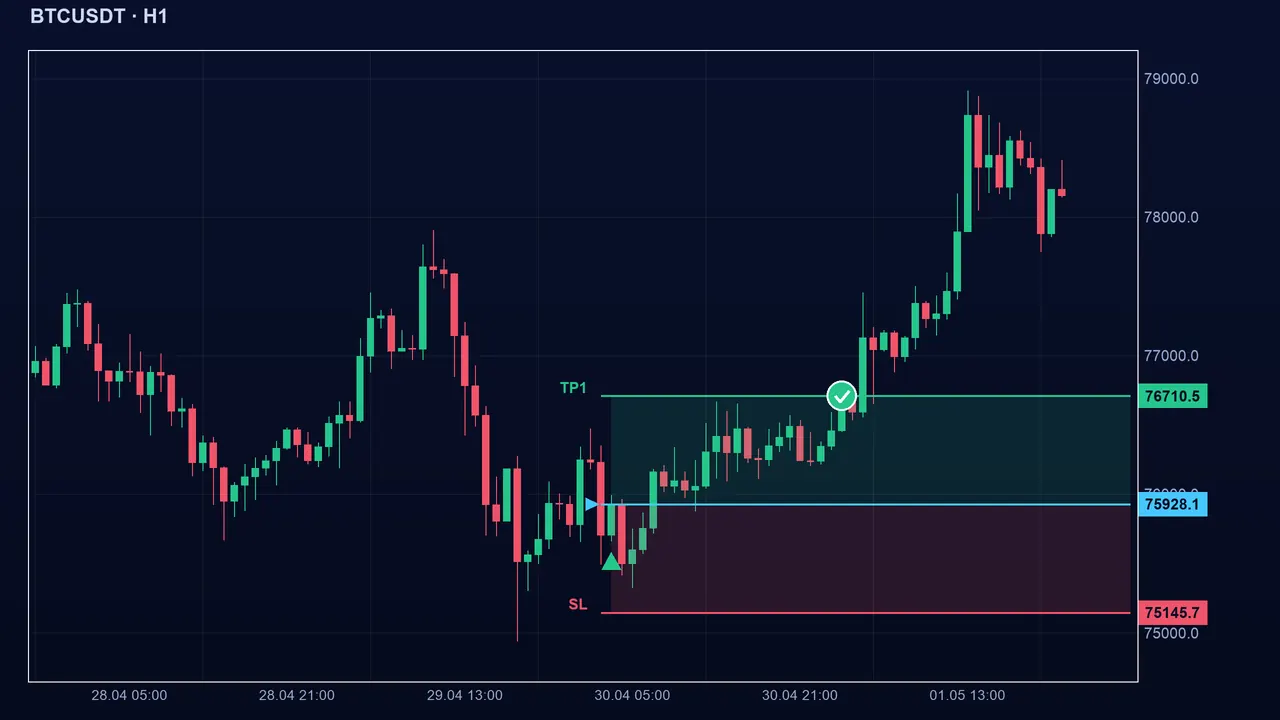
The settings
- Long smoothing (tsiLong, 25): first average. Larger, the TSI is gentler and slower.
- Short smoothing (tsiShort, 13): second average. Smaller, the TSI follows recent moves better but becomes more nervous.
- Signal line (tsiSig, 7): smaller, the line hugs the TSI and crosses multiply; larger, it reacts slowly and signals are rarer.
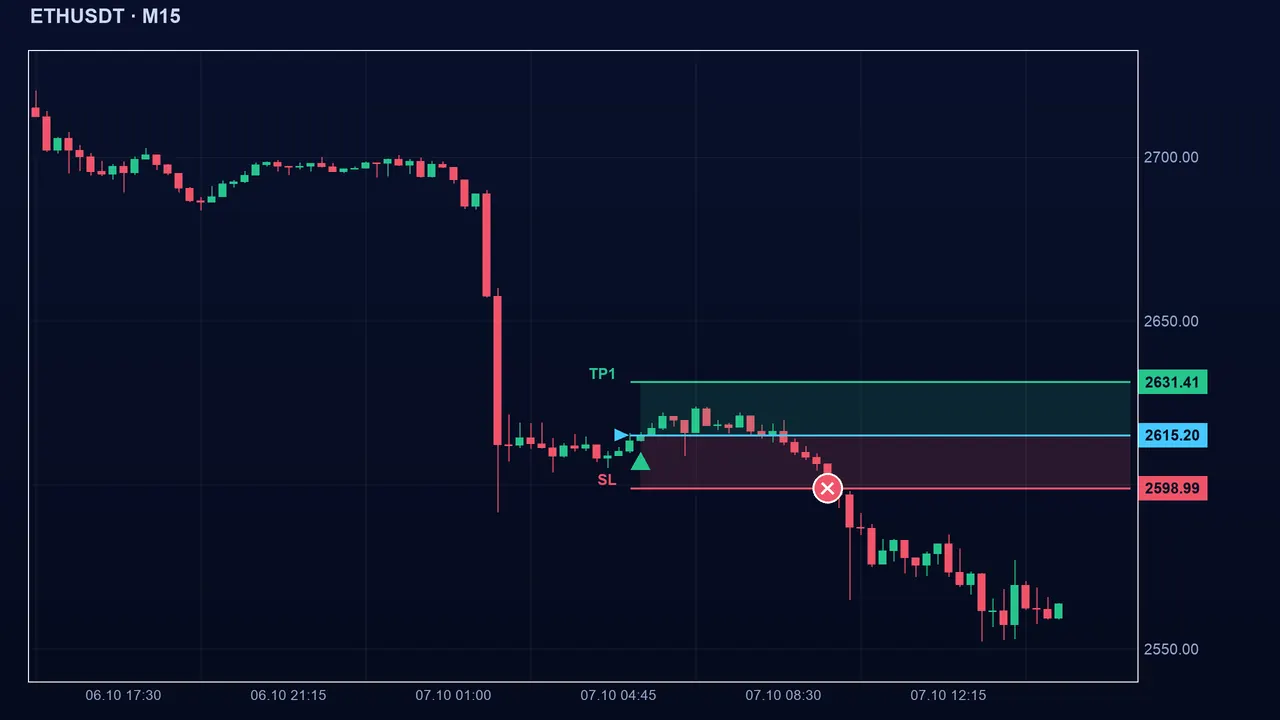
The pitfalls
Key takeaways
- TSI = 100 × (double average of the change) ÷ (double average of the absolute change).
- Signal: the TSI crosses its signal line (7-period exponential average).
- No zone filter: crosses near zero are the least reliable.
- It struggles in sideways markets; always work out the stop before entering.
📝 Lesson test
Log in to take this lesson’s test. Once you have passed all the tests, you will receive a certificate in your name.
Log inThese lessons are for understanding and are not investment advice. No method guarantees winning.