
When a market rises strongly, its closes stay near the highest high of the last candles; when it weakens, the close drifts away from it. Williams %R measures that distance: where the close sits relative to the recent high, within the range between the high and the low. It is a position indicator, useful to spot exhaustion, but never a forecast.
How it is calculated
For each candle, Algo Signals takes the last 14 (period setting). Williams %R = −100 × (highest high − close) ÷ (highest high − lowest low). It therefore lives between −100 and 0: 0 if the close is at the high, −100 if it is at the low, −50 in the middle (the value used if the range is zero).
- Close at the highest high of the 14 candles: %R = 0.
- Close at the lowest low: %R = −100. In the middle of the range: −50.
- It is the same calculation as the stochastic’s raw %K, shifted by 100: %R = raw %K − 100.
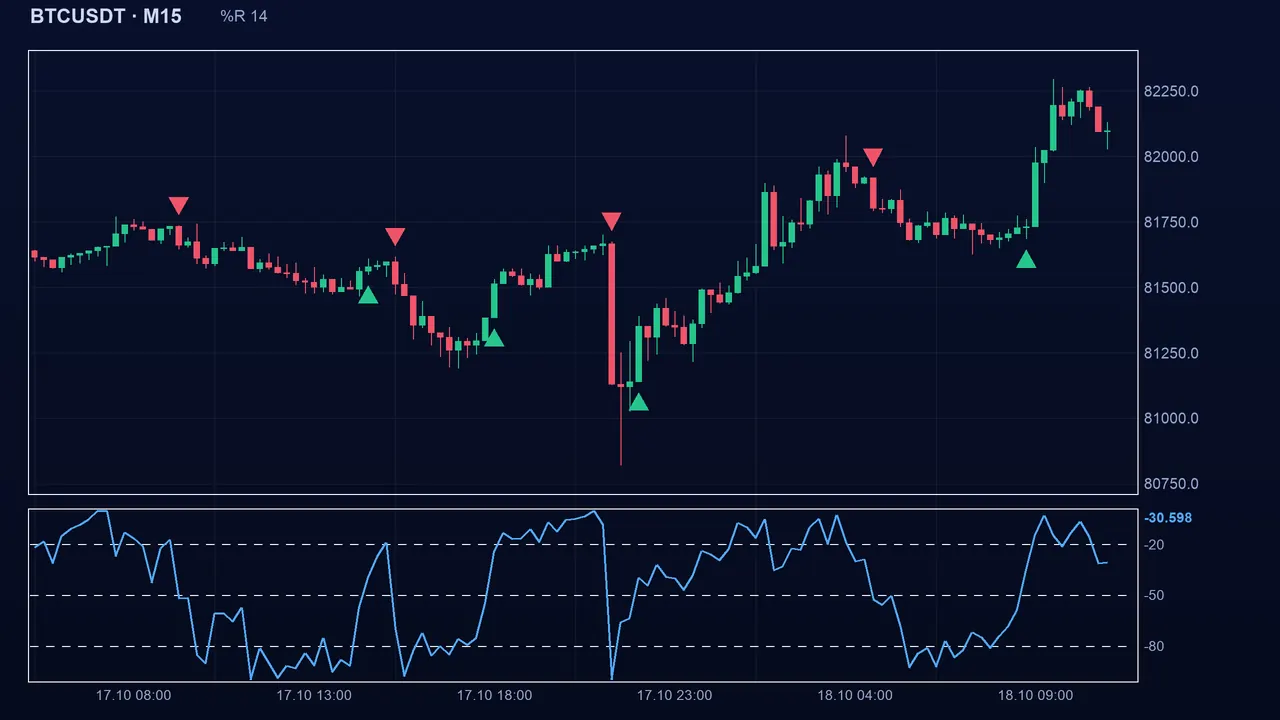
Reading the signal in Algo Signals
The “Signal” setting (sigMode) has two modes. Mode 1 (default): bias. Bullish if %R is above −50, bearish below; the signal appears as it crosses −50. Mode 2: return from the extremes. Buy when %R comes back above −80 (it leaves oversold), sell when it falls back below −20 (it leaves overbought); the state is kept until the opposite event.
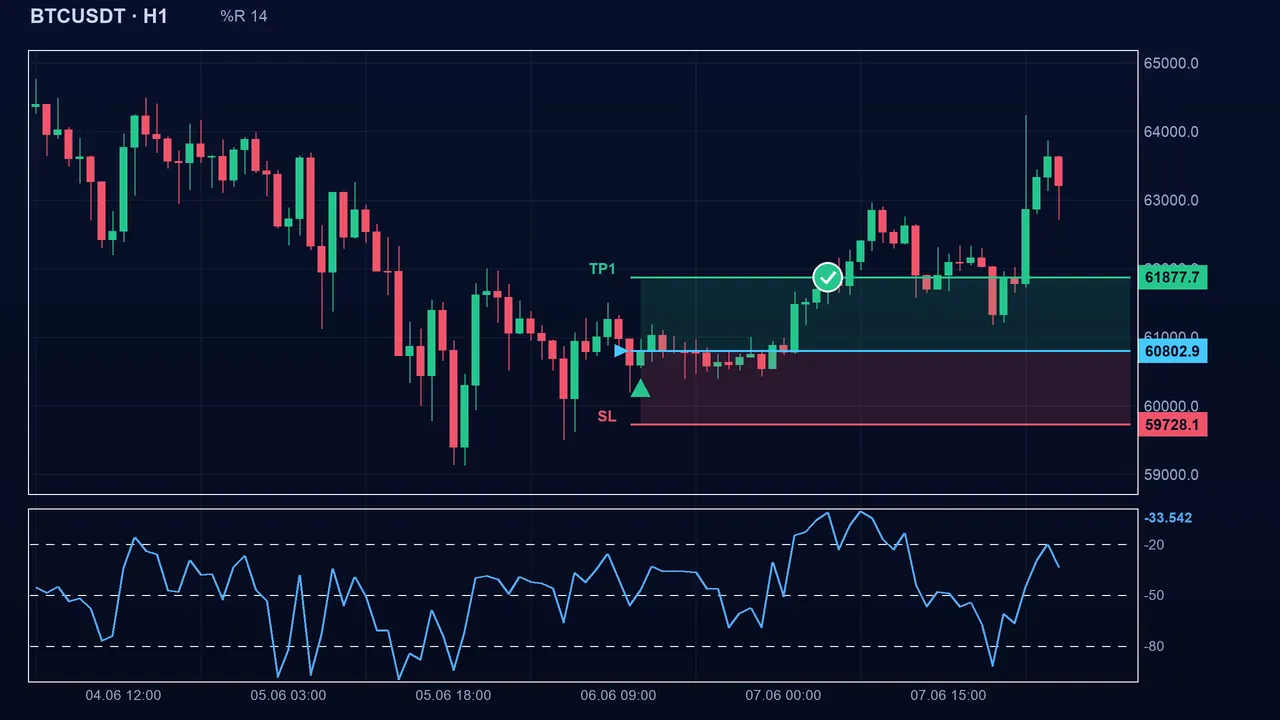
The settings
- Period (period): 14 by default (2 to 100). Shorter, %R moves fast and often touches the extremes; longer, it is calmer.
- Signal (sigMode): 1 = bias around −50 (default), 2 = return from the extremes.
- Oversold (wOs): 80 by default (51 to 99), i.e. the −80 level. Overbought (wOb): 20 by default (1 to 49), i.e. the −20 level. They only serve mode 2.
- These values are conventions: a “perfect” setting on the past does not repeat.
The pitfalls
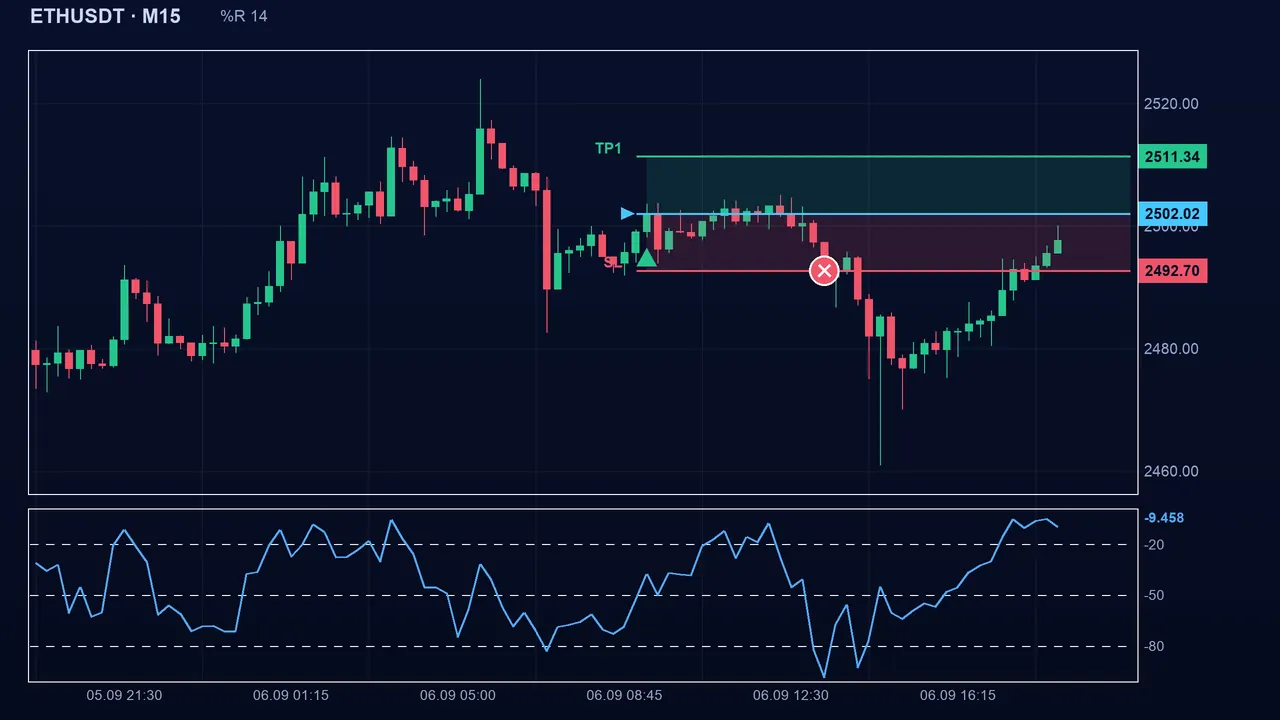
In a strong uptrend, %R can stay near 0 for a long time: each small dip takes it back below −20 and produces a sell while the price keeps rising. The reverse holds in a downtrend. Being near 0 means “the close is near the high”, not “the fall is coming”. In mode 1, a flat market makes %R oscillate around −50 and multiplies signals. On spike indices (Boom/Crash), a sudden spike changes the window’s high or low at once.
Key takeaways
- Williams %R = −100 × (highest high − close) ÷ (highest high − lowest low) over 14 candles by default; between −100 and 0.
- Mode 1: bias around −50. Mode 2: buy on the return above −80, sell on the return below −20.
- Near 0 or −100 does not mean reversal: in a strong trend it can stay there.
- Combine it with a trend filter (ADX, MA 200) or another oscillator to require several confirmations.
📝 Lesson test
Log in to take this lesson’s test. Once you have passed all the tests, you will receive a certificate in your name.
Log inThese lessons are for understanding and are not investment advice. No method guarantees winning.