
What it is for
A stretched elastic band tends to snap back. In trading you sometimes see the same thing: when price moves far from its recent average, it often returns toward it. The z-score measures this distance with a simple unit: the number of standard deviations. It is a “mean reversion” idea, the opposite of trend following. It is not always true.
How it is calculated
Algo Signals computes the simple average of the last 20 closes (default period) and their standard deviation (the usual spread around the average). The z-score is: (close − average) ÷ standard deviation. A z of −2 means the close is 2 standard deviations below the average; a z of +2, 2 above it.
It adds a trend filter: the 200-candle simple average. Buy if z is below −2.0 (default threshold) AND the close is above that 200 average. Sell if z exceeds +2.0 AND the close is below the 200 average. Otherwise, no signal.
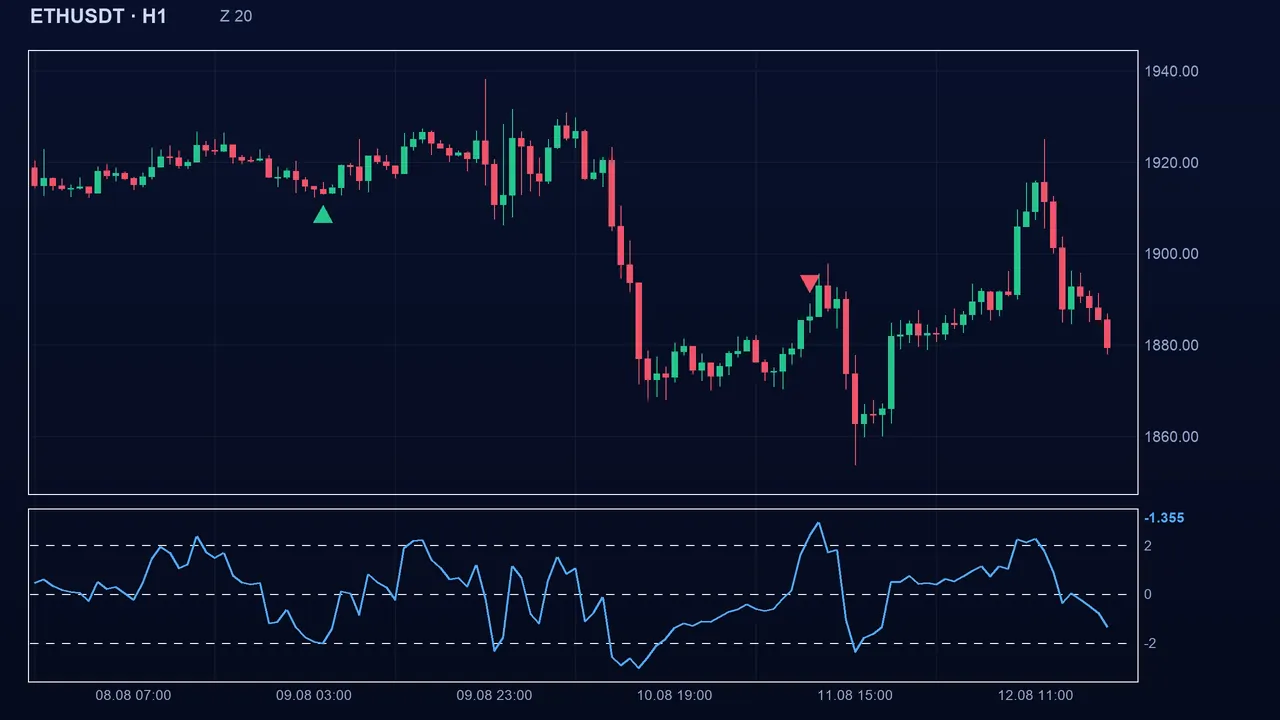
Reading the signal in Algo Signals
The idea is to buy a “dip” inside an uptrend (or sell a “spike” inside a downtrend), betting on a return to the average. The signal is not kept: it appears only on the candle where both conditions are met.
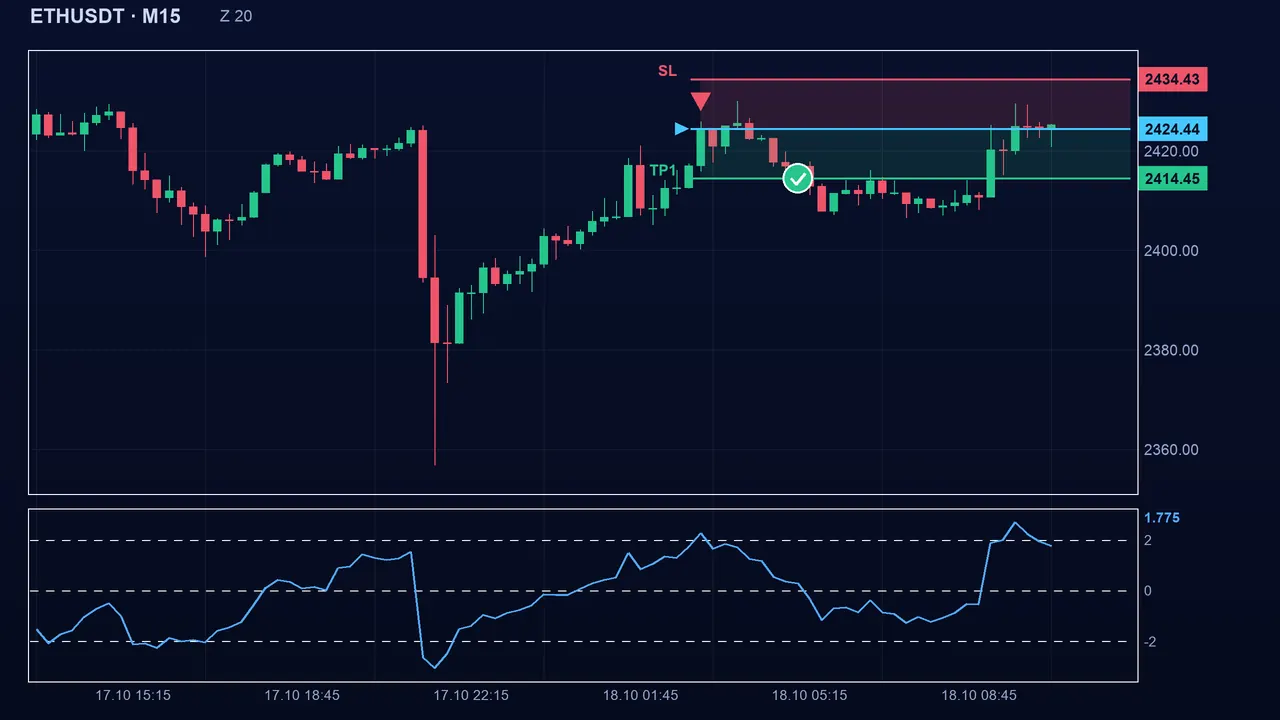
The settings
- Period: 20 by default (3 to 300). Z-score threshold: 2.0 standard deviations (0.5 to 5). Trend average: 200 (20 to 1000).
- A smaller threshold (1.5): more signals, but the stretch is less exceptional. A larger one (3): very few signals, rare stretches.
- A shorter period hugs price and gives jumpier z values; a longer one makes the average steadier.
The pitfalls
Price does not have to come back. In a violent move (news, breakout) it can keep drifting away: you then buy “too early” in a fall that continues. Also, the standard deviation grows when candles spread out, so z does not become as extreme as you might think. Finally, the trend filter blocks signals against the 200 average.
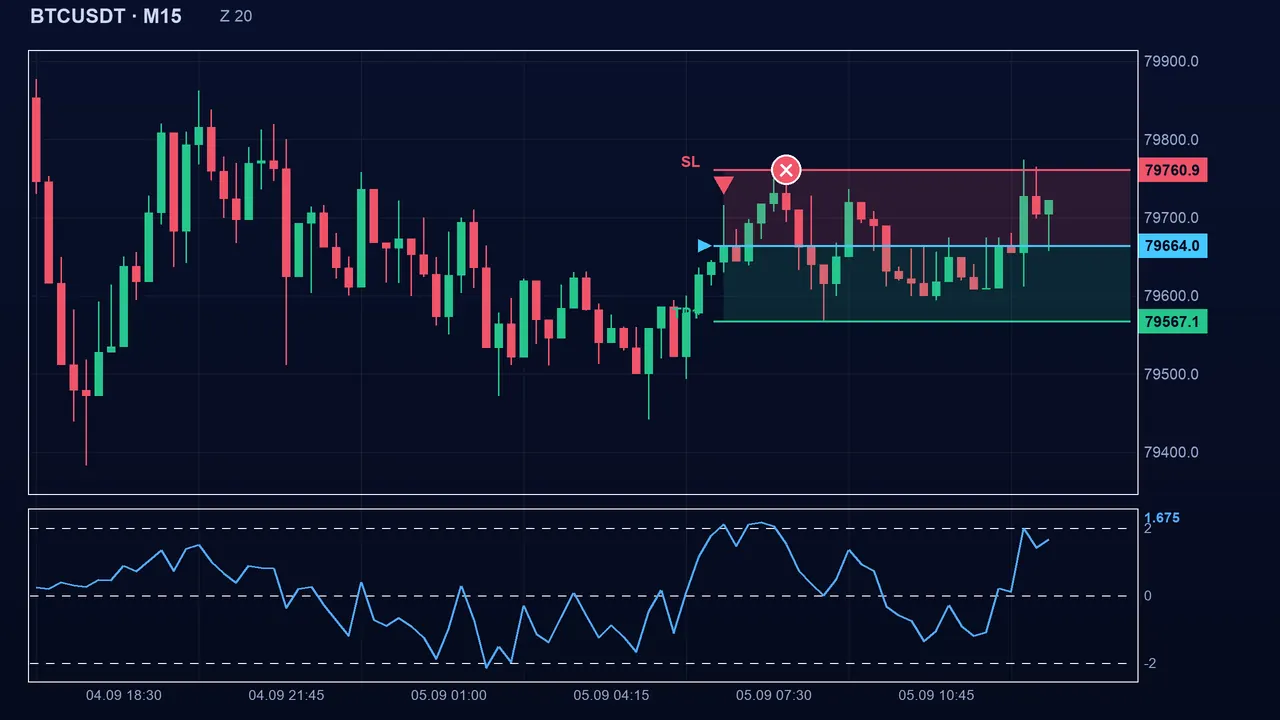
Key takeaways
- Z-score = (close − average of the last 20) ÷ standard deviation; default threshold ±2.0.
- Buy if z < −2.0 and close above the 200 average; sell if z > +2.0 and close below the 200 average.
- It is a bet on a return to the average, which may not happen in a violent move.
- In confluence: combine it with an oscillator (RSI) or a support / resistance zone, and always use a stop-loss.
📝 Lesson test
Log in to take this lesson’s test. Once you have passed all the tests, you will receive a certificate in your name.
Log inThese lessons are for understanding and are not investment advice. No method guarantees winning.