What it is for
The VWAP (Volume Weighted Average Price) is the average price at which trades actually took place: a price traded with a lot of volume counts more than one traded with little. It acts as the “fair price” of the moment. When price moves far away from it, it often tends to come back. The VWAP deviation indicator looks for these stretches, in the direction of the underlying trend.
How it is calculated
Over the last 50 candles (default window), Algo Signals computes the VWAP: the sum of (typical price × volume) divided by the sum of volumes. A candle’s typical price is (high + low + close) ÷ 3. It then computes the standard deviation of the closes around the VWAP, that is, the usual distance between price and VWAP.
Buy if the close is below the VWAP by more than 1.5 standard deviations AND above the 200-candle simple average. Sell if the close is above the VWAP by more than 1.5 standard deviations AND below the 200 average. Volume is real when the market supplies it (for example Binance); otherwise it is estimated from the candle’s range.
Reading the signal in Algo Signals
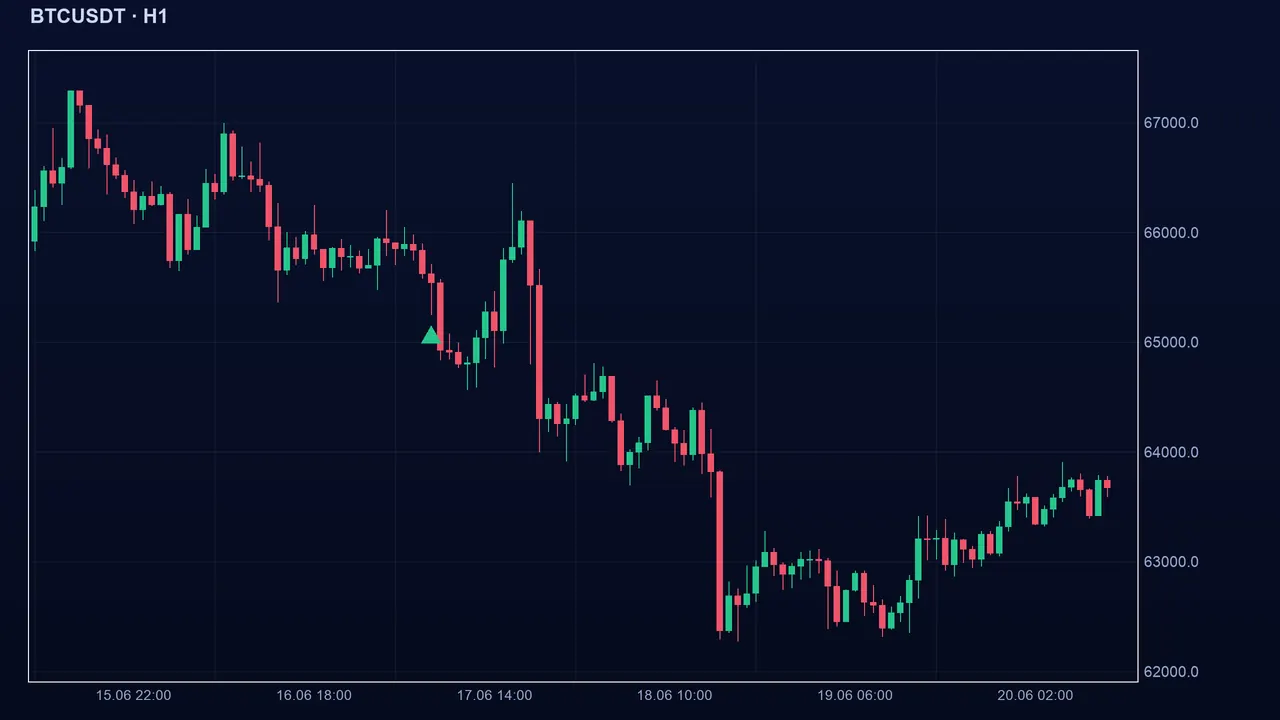
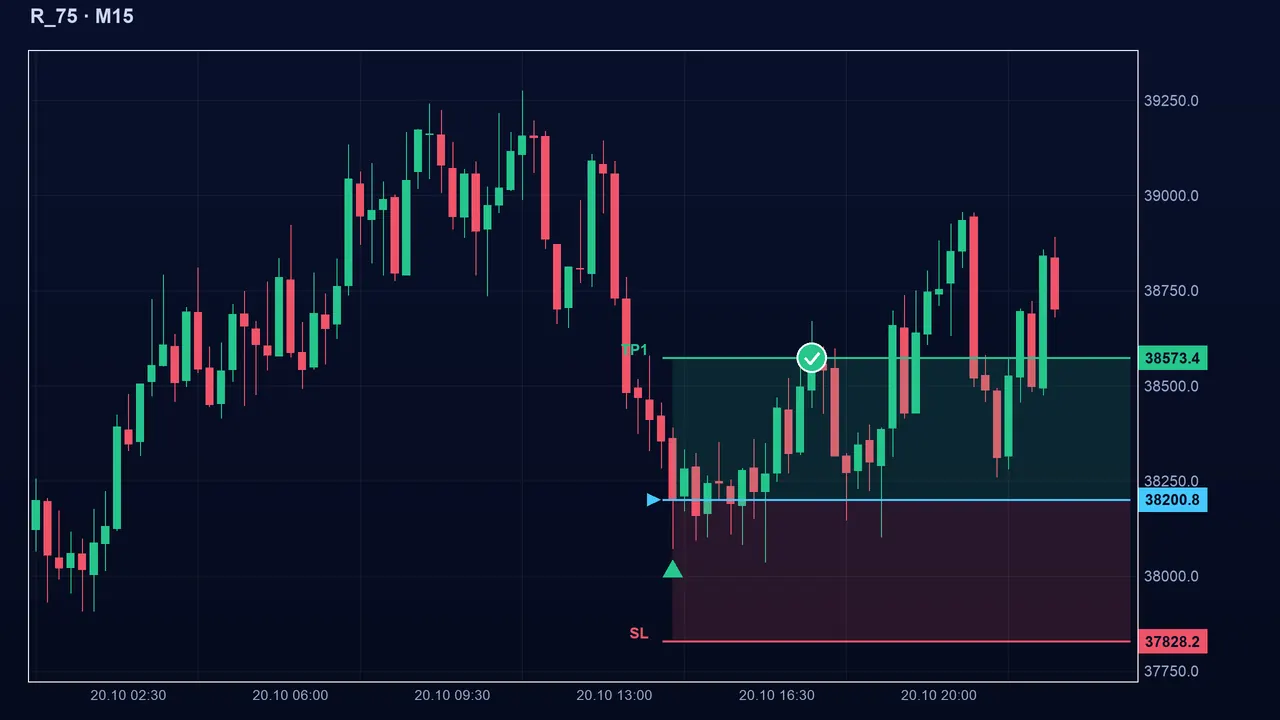
The signal is a bet on a return toward the VWAP, filtered by the underlying trend. It is not kept: it appears only on the candle that meets every condition. The history must contain at least 50 candles for the VWAP to be computed.
The settings
- Window: 50 candles by default (5 to 500). Deviation: 1.5 standard deviations (0.5 to 5). Trend average: 200 (20 to 1000).
- A smaller deviation (1.0): more signals, but price is barely stretched. A larger one (2.5): few signals, rare stretches.
- A shorter window makes the VWAP very reactive; a longer one is slower and steadier.
The pitfalls
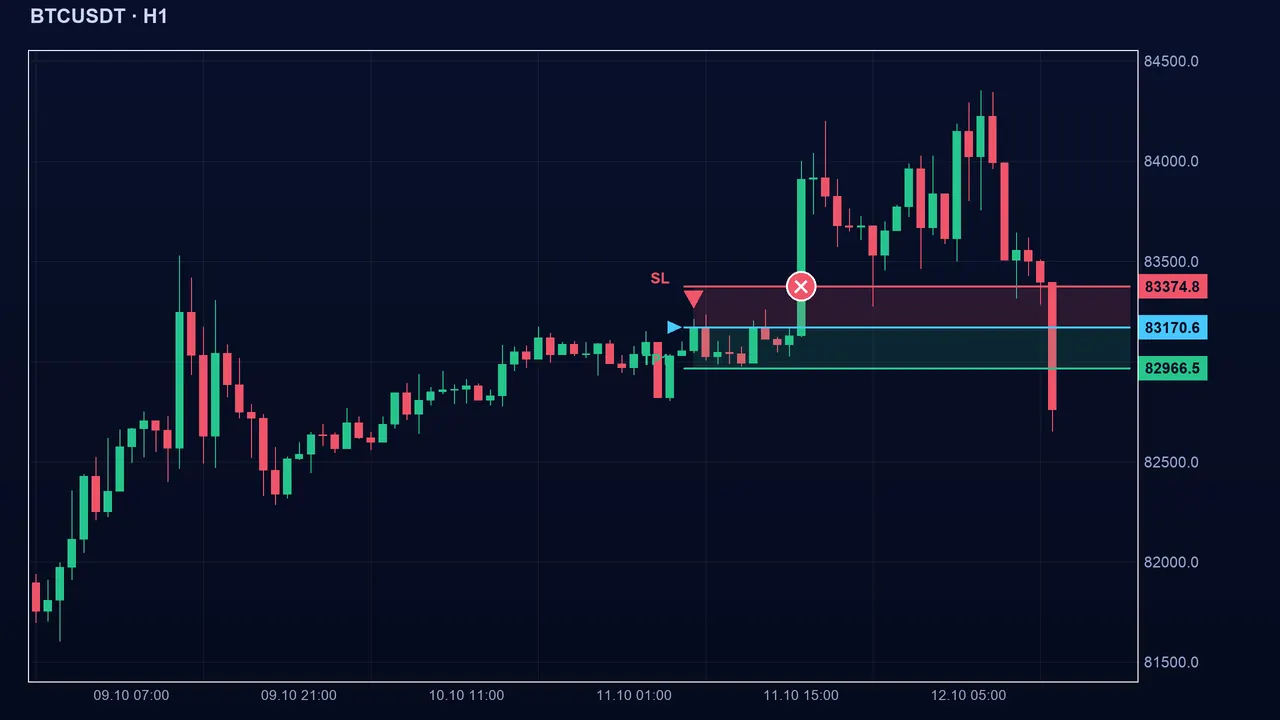
On synthetic indices (Boom, Crash, Volatility) there is no real volume: the range-based estimate makes the VWAP less reliable. Also, a move that sets in (news, breakout) can keep price away from the VWAP for a long time: the VWAP, being an average, catches up late. A return is never guaranteed.
Key takeaways
- VWAP = volume-weighted average price (50-candle window by default); the deviation is measured in standard deviations (1.5 by default).
- Buy below the lower band with a close above the 200 average; mirrored for sells.
- Without real volume (synthetic indices), the VWAP is only an estimate.
- In confluence: combine it with a support / resistance zone or an oscillator, and always use a stop-loss.
📝 Lesson test
Log in to take this lesson’s test. Once you have passed all the tests, you will receive a certificate in your name.
Log inThese lessons are for understanding and are not investment advice. No method guarantees winning.