
Pivot points are levels computed from the previous session: many traders watch them because they are known in advance and identical for everyone. Algo Signals’ pivots method uses them to place the stop under the nearest protective level and the targets on the next levels.
How the levels are calculated
From the high H, low L and close C of the previous period (the UTC day by default, or the week), the code computes the pivot P = (H + L + C) / 3, the CPR (upper edge TC and lower edge BC), the supports and resistances S1 to S3 and R1 to R3 (R1 = 2P − L, S1 = 2P − H, R2 = P + (H − L), S2 = P − (H − L)), and the Camarilla levels H3, H4, L3, L4 (for instance H3 = C + 0.275 × (H − L)). Thirteen levels are kept as references. The entry price is the close of the signal candle.
- Stop of a buy: the highest of the levels at least 0.3 ATR under entry, minus 0.25 ATR. For a sell, symmetric above.
- If this stop is more than 3 ATR or less than 0.5 ATR from entry, or if no level is available, it is brought back to 1.5 ATR.
- TP1: the first level at least 0.3 ATR above entry, if it is at least 0.5 times the risk away; otherwise entry + 1.5 × risk.
- TP2: the next level, beyond TP1 + 0.1 ATR; otherwise entry + 2.5 × risk.
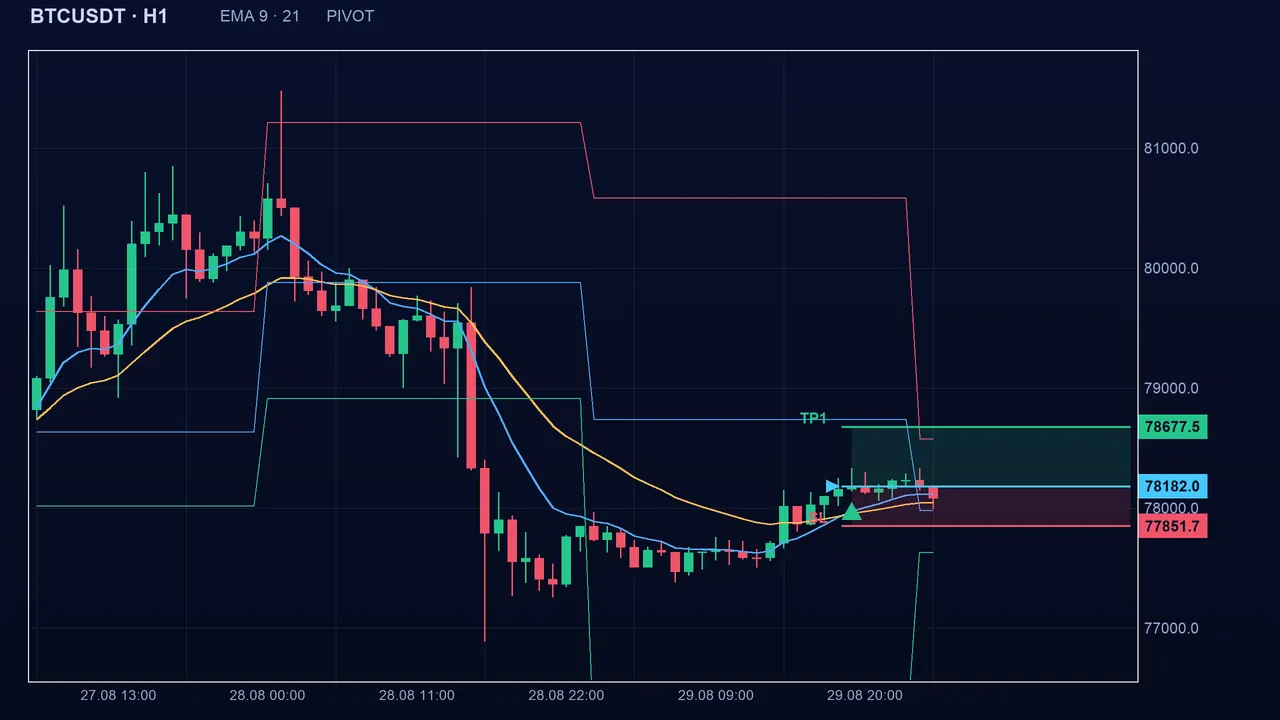
A worked case
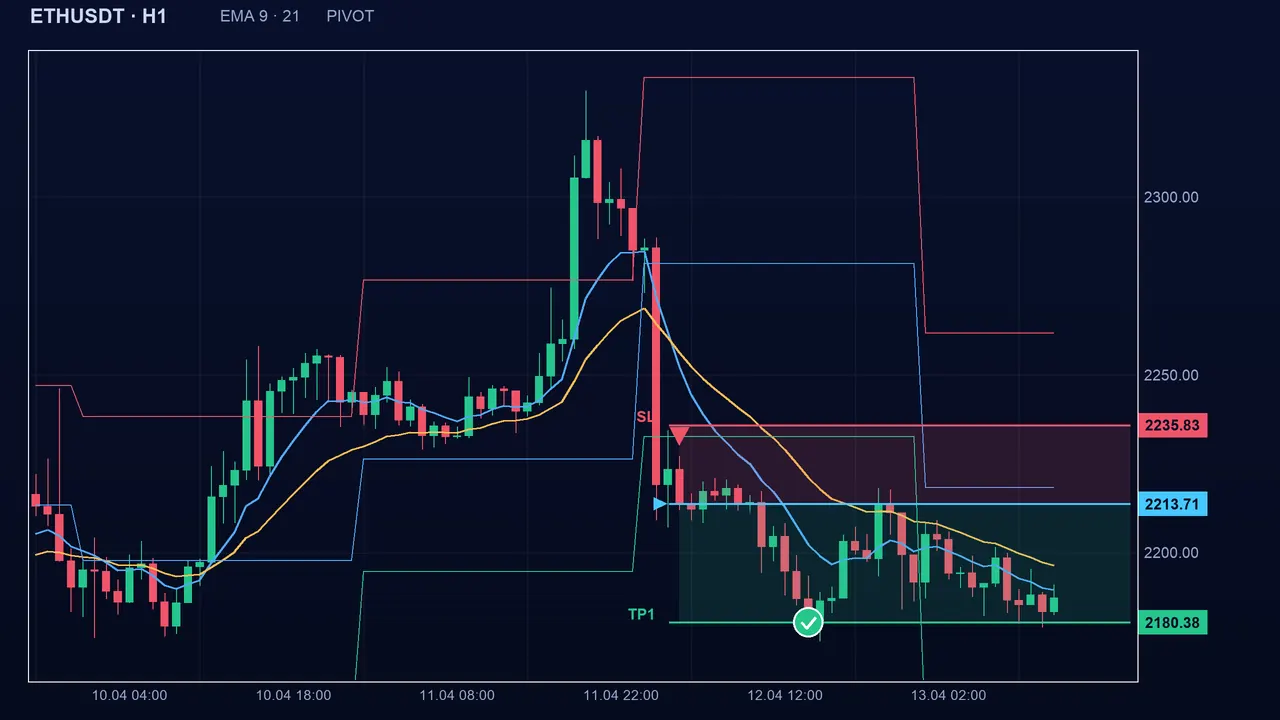
The levels come from the previous period and do not move during the session: you can check them in advance. For a sell, the stop goes above the nearest level above entry, and the targets on the levels below.
Settings and safeguards
- This method has no stop or target settings of its own: the distances 0.3 ATR, 0.25 ATR, 0.5 ATR, 3 ATR, 1.5 and 2.5 times the risk are fixed in the code.
- Pivot period (pivPeriod of the Pivot Points indicator): 1 = day (default), 2 = week. A longer period gives more widely spaced levels.
- Common safeguards (“guarded” method): stop more than 0.1 ATR away on the losing side; cap maxSlAtr (0 = unlimited); TP1 at least 1 times the risk; TP2 at least 2 times the risk and 0.5 risk beyond TP1.
- Without levels (start of the history), the method uses stop 1.5 ATR, TP1 1.5 ATR and TP2 3 ATR.
The day’s levels are computed on the previous day, so the start of the loaded history may not have any. The safeguard has nothing to correct in the example above: TP1 is at 1.11 times the risk and TP2 at 2.32 times.
The pitfalls
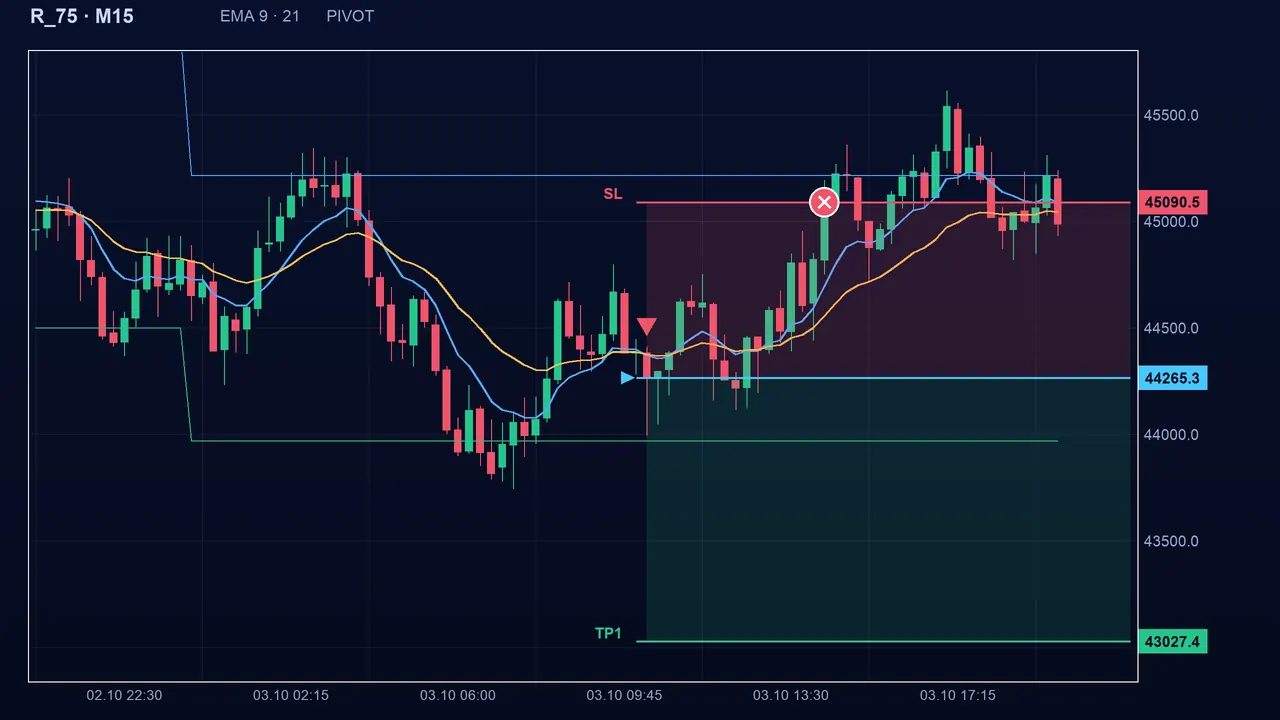
A heavily watched level is not a barrier: price often crosses it. And on a quiet day the levels are very tight; on a busy day, the previous day may have created levels already passed.
Key takeaways
- Stop 0.25 ATR under the nearest protective level; TP1 and TP2 on the next levels.
- If the level is too far (over 3 ATR) or too close, fallback to 1.5 ATR; if TP1 is too close, 1.5 times the risk.
- No stop setting specific to the method: only the period (day or week) is chosen.
- The levels are computed on the previous period and known in advance.
- Confluence: a pivot level that coincides with a chart support or resistance carries more weight.
📝 Lesson test
Log in to take this lesson’s test. Once you have passed all the tests, you will receive a certificate in your name.
Log inThese lessons are for understanding and are not investment advice. No method guarantees winning.