
What is the “Structure” method for?
A market draws peaks and troughs. The “Structure” method (structure) relies on them: for a buy, the stop goes below the last trough (swing low) that protects the entry, and the targets on the peaks (swing highs) above. The stop and targets thus follow the chart, not an arbitrary rule.
How the levels are calculated
A pivot of strength left (3 by default) is a candle whose low (or high) is matched or exceeded by the 3 candles on each side. So 3 candles are needed after it to confirm it. The engine examines the last cdN candles (60 by default). Buy: the most recent swing low below the entry gives SL = pivot − cdBuf × ATR (0.3 ATR). TP1 and TP2 are the two nearest swing highs above the entry (by more than 0.1 ATR); if they are missing, rr1 (1) and rr2 (2) times the risk are used.
For a sell, everything is reversed. If no protective pivot exists, or if the stop is closer than 0.1 ATR to the entry, the method falls back to the default ATR. Finally the TP/SL safeguards apply: TP1 must be worth at least 1 times the risk, TP2 at least 2 times.
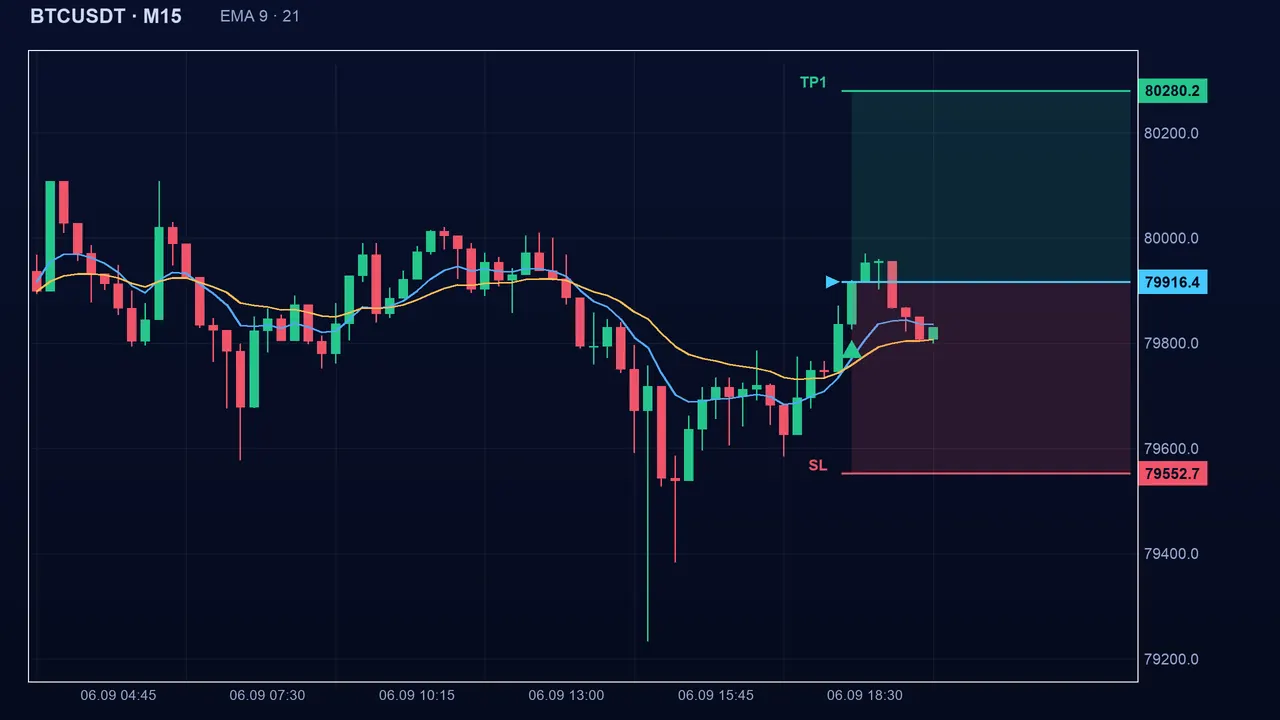
Reading a signal with this method
Ratios: TP1 ≈ 1.10 times the risk and TP2 ≈ 2.27 times. If the stop is hit first: −1R. If TP1 is hit first: about +1.10R. With $10 of risk, each pip of stop is worth about 10 ÷ 26.4 = $0.38. Note that the targets are chart levels: they can form a resistance zone where price hesitates.
The settings
- left (default 3, from 1 to 20): pivot strength. Larger, fewer but more significant pivots, confirmed later.
- cdN (default 60, from 10 to 400): number of candles explored to find pivots.
- cdBuf (default 0.3): stop margin beyond the pivot, in ATR.
- rr1 (default 1) and rr2 (default 2): multiples of the risk used when swing highs (or lows for a sell) are missing.
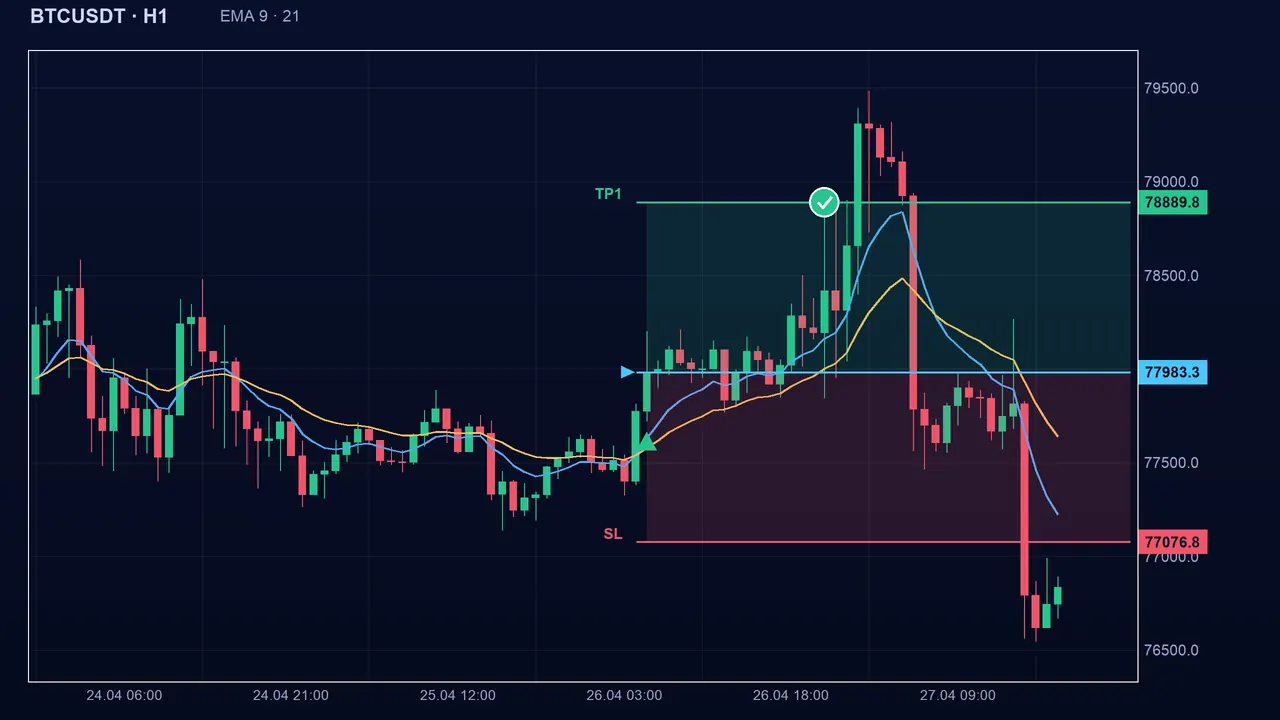
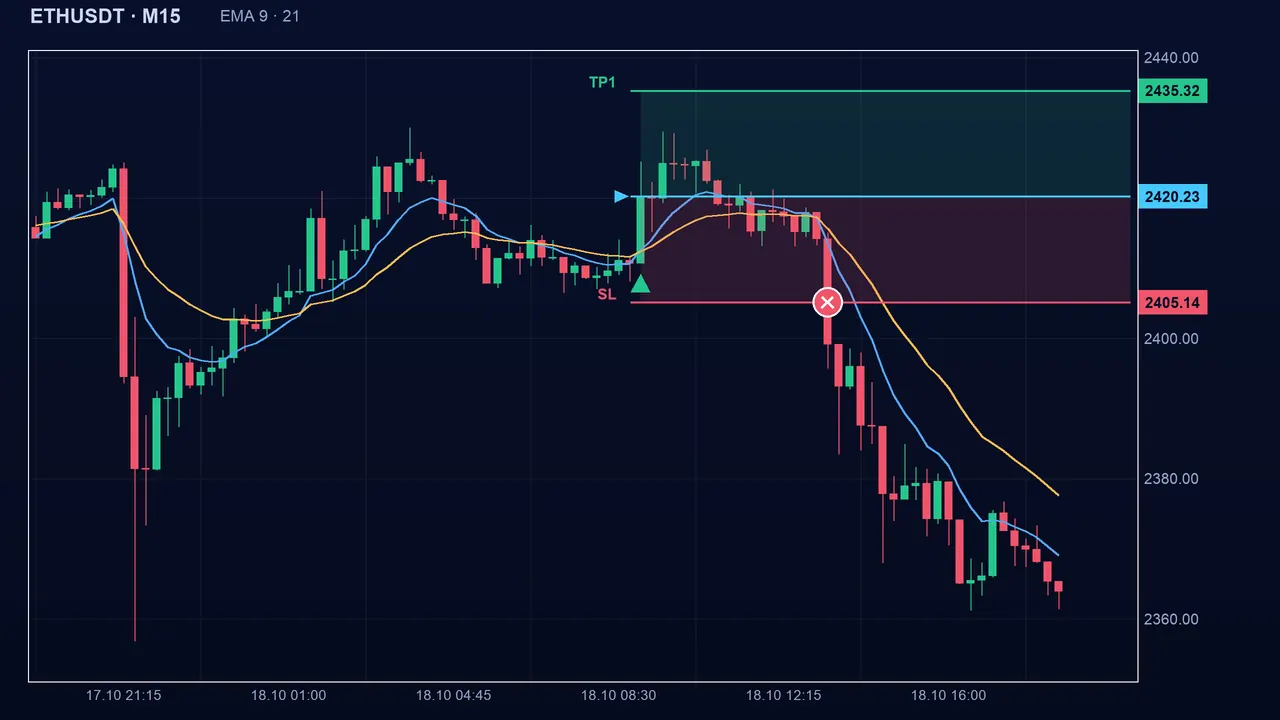
The pitfalls
Key takeaways
- Structure = stop below the last protective swing low, targets on the next swing highs.
- A pivot only exists 3 candles after it forms (left setting).
- Without a useful pivot, targets are multiples of the risk; without a protective pivot, fallback to the ATR.
- The safeguards can stretch a TP1 that is too close.
📝 Lesson test
Log in to take this lesson’s test. Once you have passed all the tests, you will receive a certificate in your name.
Log inThese lessons are for understanding and are not investment advice. No method guarantees winning.