
What it is for
A price move rarely goes in a straight line: it rises, catches its breath, then carries on (or not). That pullback is called a retracement. Fibonacci ratios (38.2%, 50%, 61.8%, 78.6%) are used by many traders to locate where the pullback might stop. There is no proof that these levels have any special power; their interest comes mostly from being widely used.
How it is calculated
Algo Signals finds pivots (peaks and troughs surrounded by 3 candles on each side, confirmed 3 candles later). The “leg” is the latest move between the last two pivots. It must measure at least 1.5 times the ATR 14 (the average volatility), to rule out micro-moves.
For an upward leg (trough to peak), the retracement is (peak − close) ÷ the leg’s range. If the close has come back between 38.2% and 78.6% (settings “Fibonacci low / high”), the state is bullish (buy zone). For a downward leg it is the mirror image: bearish state if the close has bounced back between 38.2% and 78.6%. Otherwise, neutral.
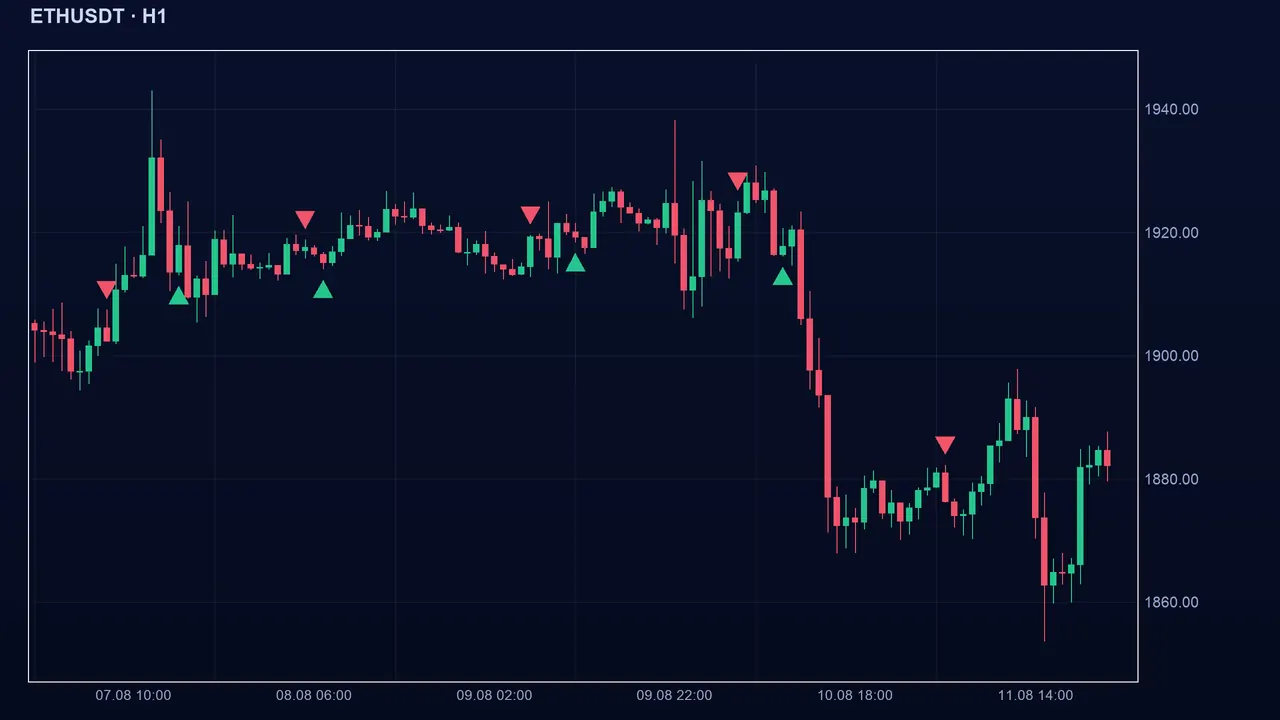
Reading the signal in Algo Signals
It is a filter: with other trigger indicators ticked, a buy is kept only if the close is in the pullback zone of an upward leg. Ticked alone, it gives its own signals when the state changes. The whole zone counts, not just the 61.8%.
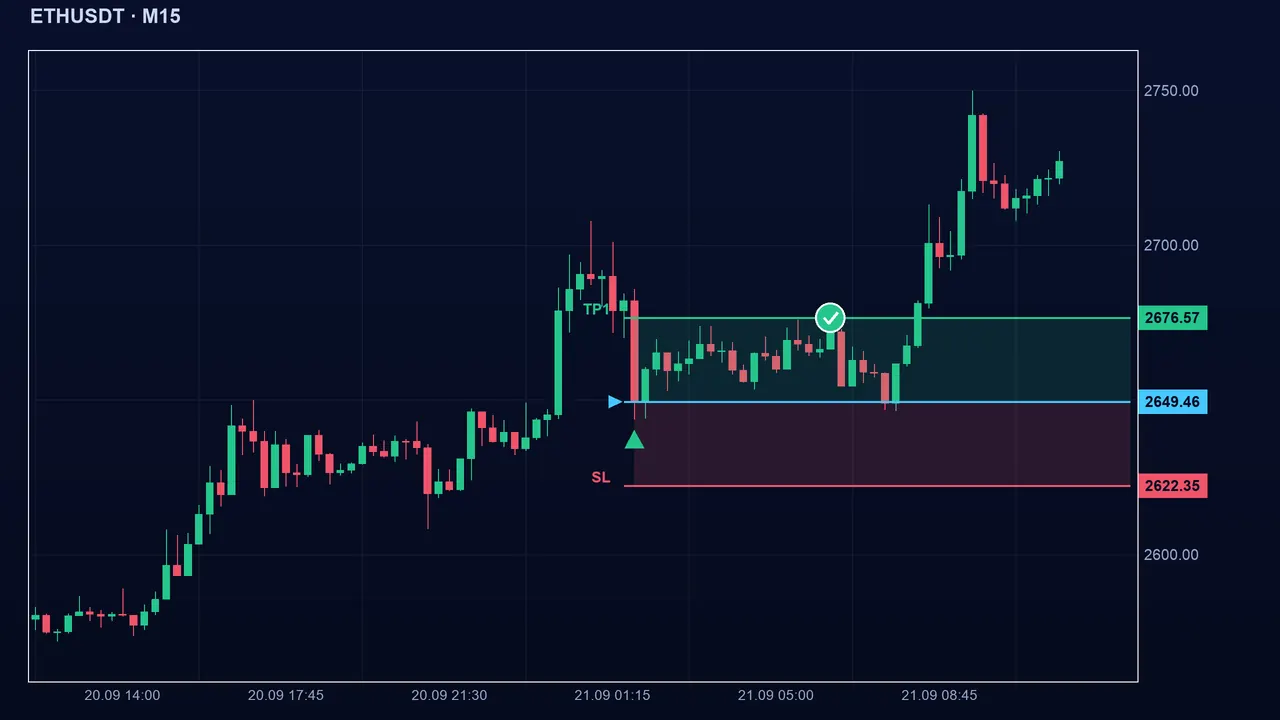
The settings
- Candles left / right: 3 and 3 (1 to 20). Fibonacci low: 0.382 (0 to 1). Fibonacci high: 0.786 (0 to 1). Minimum leg: 1.5 × ATR (0.1 to 10). ATR period: 14 (1 to 100).
- A narrower zone (0.5 to 0.618): rarer signals, a “classic” pullback. A wider one (0.236 to 0.886): more signals, sometimes too deep a pullback.
- A larger minimum leg: only big moves; a smaller one: more small, noisy legs.
The pitfalls
The pullback may not stop: price goes through the zone and cancels the move. Beyond 78.6%, the indicator goes neutral again (pullback too deep). And the leg changes with every newly confirmed pivot: the zone is not fixed, it is redrawn with the market.
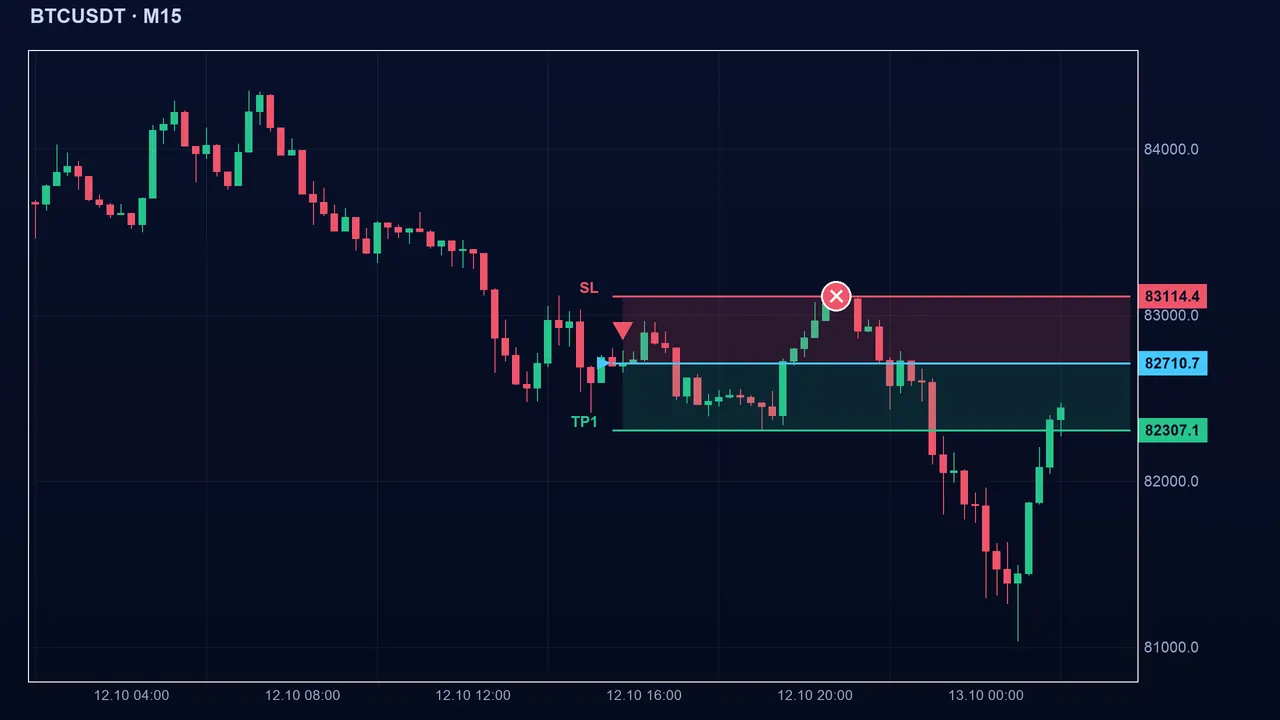
Key takeaways
- Leg = latest move between two pivots, at least 1.5 × ATR 14; pullback zone = 38.2% to 78.6% by default.
- Bullish if the close has come back into the zone after an upward leg; bearish as a mirror.
- No proof that Fibonacci levels have any special power; the zone is redrawn at every pivot.
- In confluence: combine it with a support / bullish structure and a trigger, stop-loss below the bottom of the leg.
📝 Lesson test
Log in to take this lesson’s test. Once you have passed all the tests, you will receive a certificate in your name.
Log inThese lessons are for understanding and are not investment advice. No method guarantees winning.