
What it is for
A rising market draws higher and higher peaks and higher and higher troughs; a falling market does the opposite. That is “structure”. Reading it means knowing which side the market is on before looking for an entry. Algo Signals offers two readings: highs / lows (hhll) and structure breaks (structure). They are background filters, not entry triggers.
How they are calculated
Both start from pivots: a peak is a high surrounded by 3 lower candles on each side, a trough is the opposite (settings “candles to the left / right”: 3 and 3). A pivot is therefore confirmed only 3 candles later: no repainting, but a slight delay.
Highs / lows (hhll): each peak is compared with the previous one (HH higher, LH lower), and likewise each trough (HL higher, LL lower). Bullish state if the last peak is an HH AND the last trough an HL, and the close stays above that last trough. Bearish if LH and LL, with a close below the last peak. Otherwise neutral. Break (structure): a candle closes beyond an old peak (bullish break) or below an old trough (bearish). The state follows the latest break.
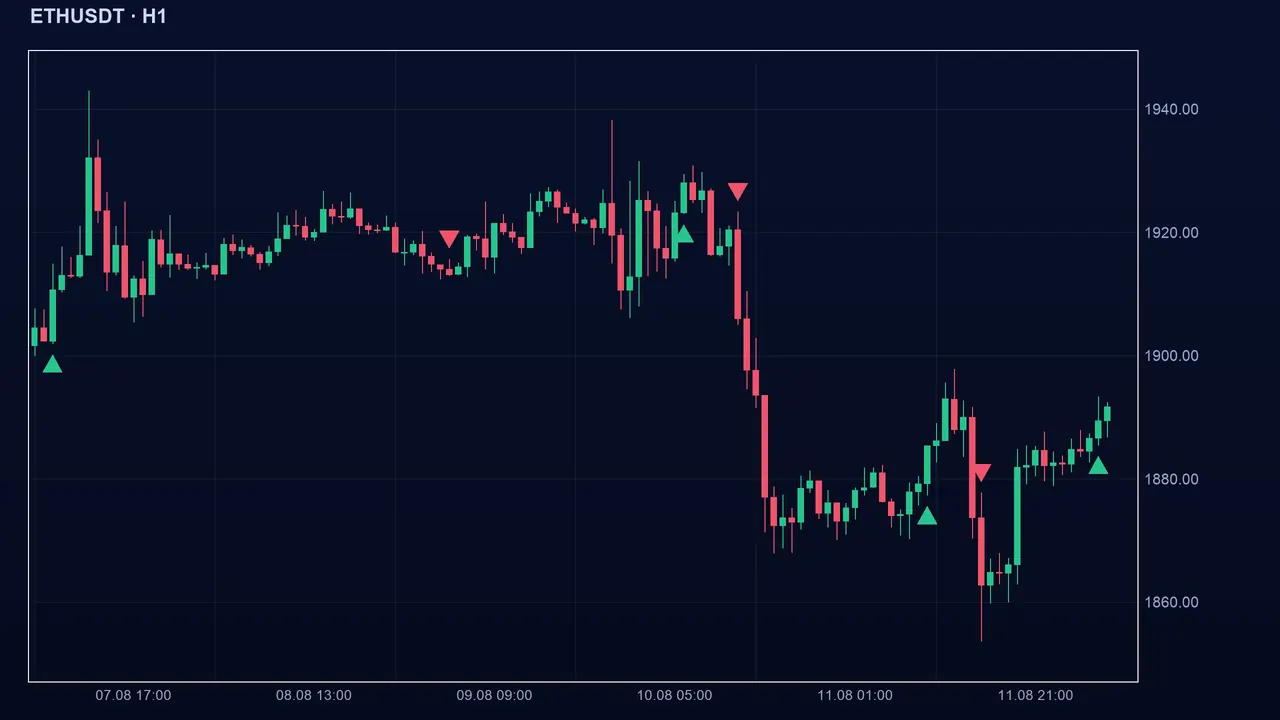
Reading the signal in Algo Signals
When other trigger indicators are ticked, hhll and structure filter: a buy is kept only if the filters are bullish, a sell only if they are bearish. Ticked alone, they give their own signals when their state changes. Only the close counts, not the wick.
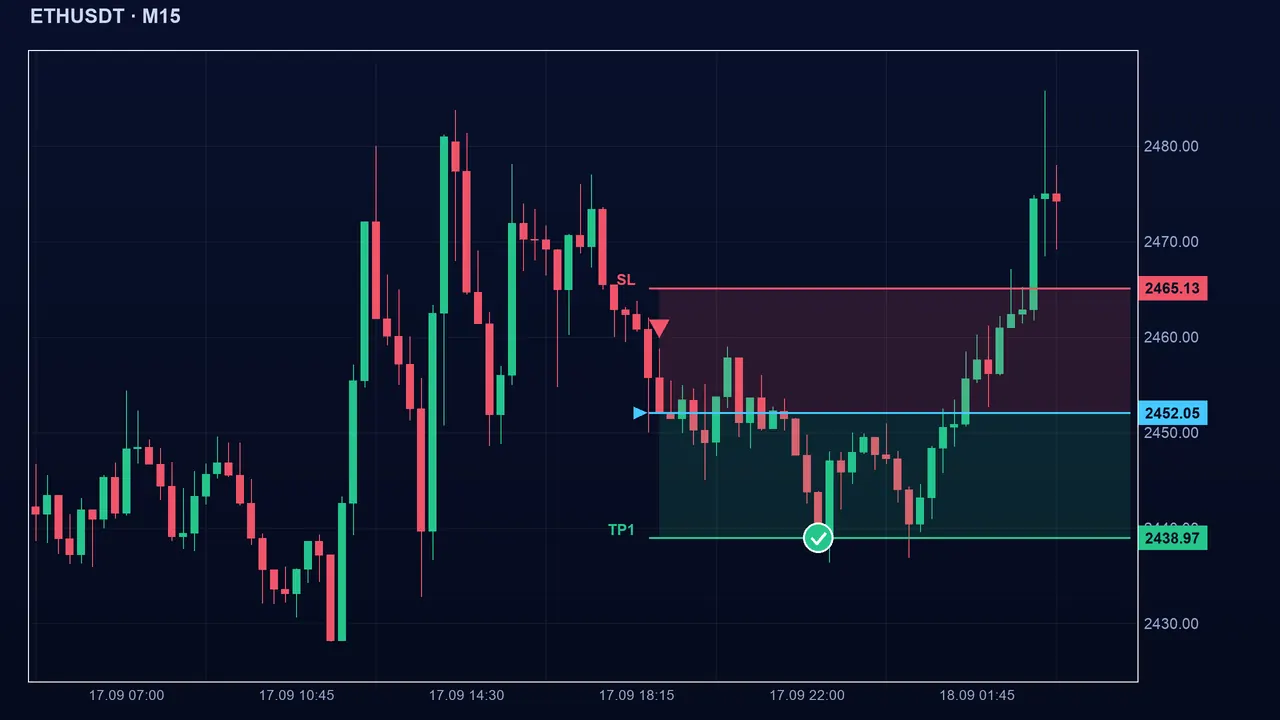
The settings
- For each of the two: candles to the left and right, 3 by default (1 to 20).
- More candles on each side: fewer pivots, more significant, but confirmed later.
- Fewer candles (1 or 2): many pivots, a very jumpy structure, many false state changes.
The pitfalls
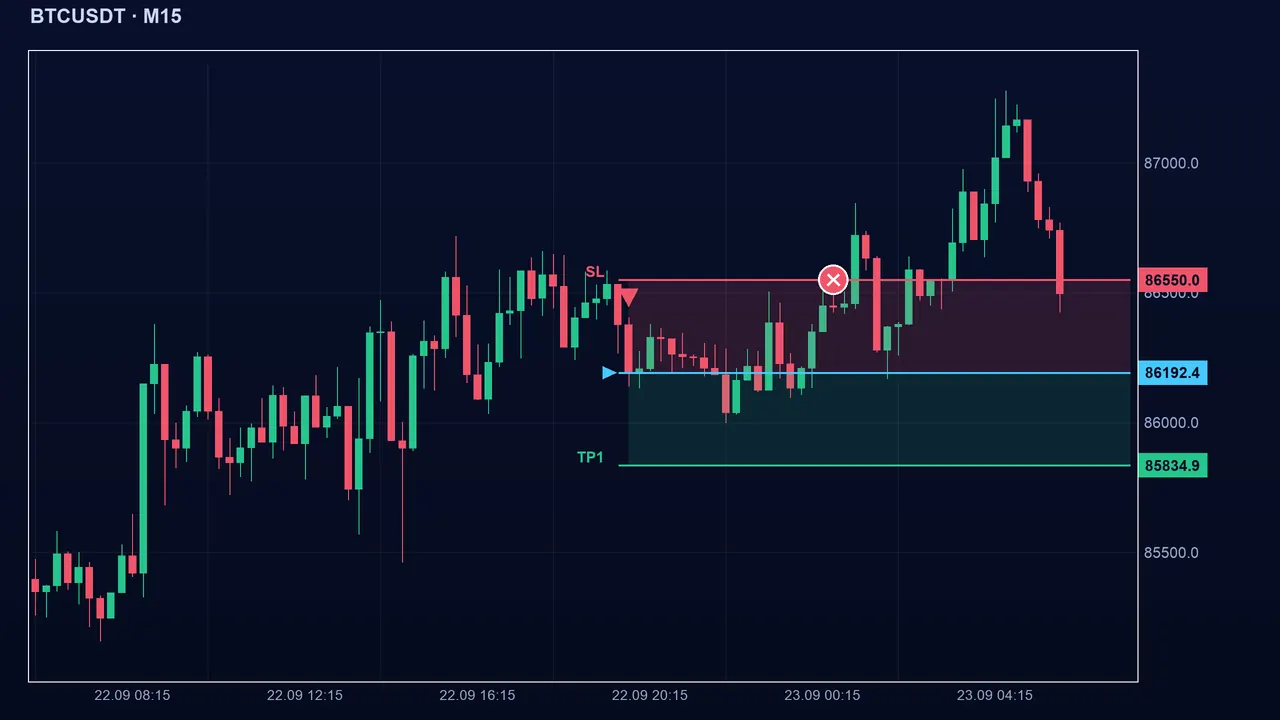
In a ranging market, peaks and troughs get mixed: hhll stays neutral, and structure can flip again and again. A one-pip break still counts as a break; it may just be a false exit. And since the state is kept until the opposite break, a false break can stay “valid” for a long time.
Key takeaways
- HH + HL = bullish structure; LH + LL = bearish structure; a mix of both = neutral.
- A structure break is a close beyond an old peak or trough, not just a wick.
- Pivots are confirmed 3 candles later (default): a slight delay, no repainting.
- In confluence: these are background filters, to combine with a trigger and a stop-loss beyond the last trough or peak.
📝 Lesson test
Log in to take this lesson’s test. Once you have passed all the tests, you will receive a certificate in your name.
Log inThese lessons are for understanding and are not investment advice. No method guarantees winning.