
A single moving average gives a direction. Five stacked averages also hint at how solid that direction is. That is the idea behind the moving-average ribbon, called ribbon in Algo Signals.
What the ribbon is for
When a trend is clear, the fast averages move away from the slow ones and line up neatly, like the ribs of a fan. When the market hesitates, they cross and tangle. The ribbon therefore helps tell a well-established trend from a confused market.
How it is calculated
Algo Signals computes five exponential averages (EMA) of closing prices, with periods 8, 13, 21, 34 and 55. Each EMA is close × k + previous EMA × (1 − k), with k = 2 ÷ (period + 1), about 0.222 for 8 and 0.036 for 55. The state is bullish if the five are strictly ordered from the fastest (on top) to the slowest (at the bottom), bearish if the order is exactly reversed, and neutral in every other case, including while candles are missing.
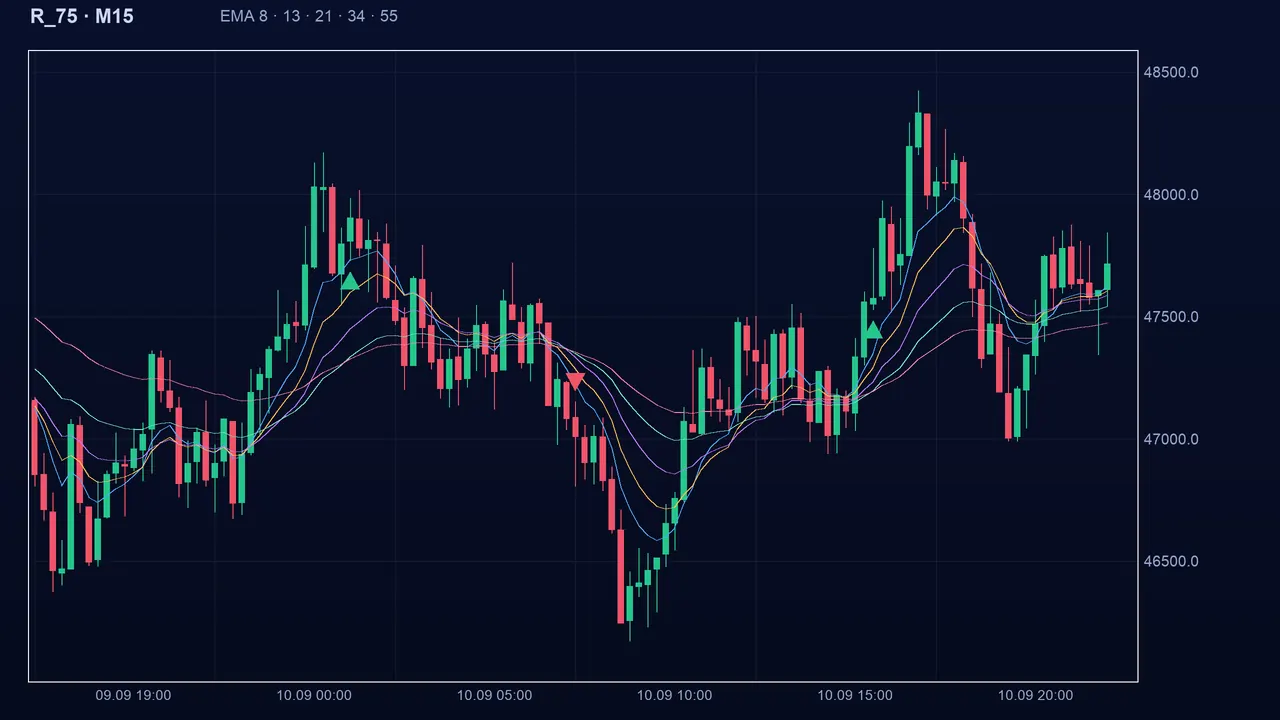
Reading the signal in Algo Signals
The ribbon has three states: bullish, bearish, neutral. A buy signal appears when it turns bullish, a sell signal when it turns bearish. When the ribbon is the only indicator ticked, a return to the same direction after a neutral pause does not create a new signal: an opposite signal must come first.
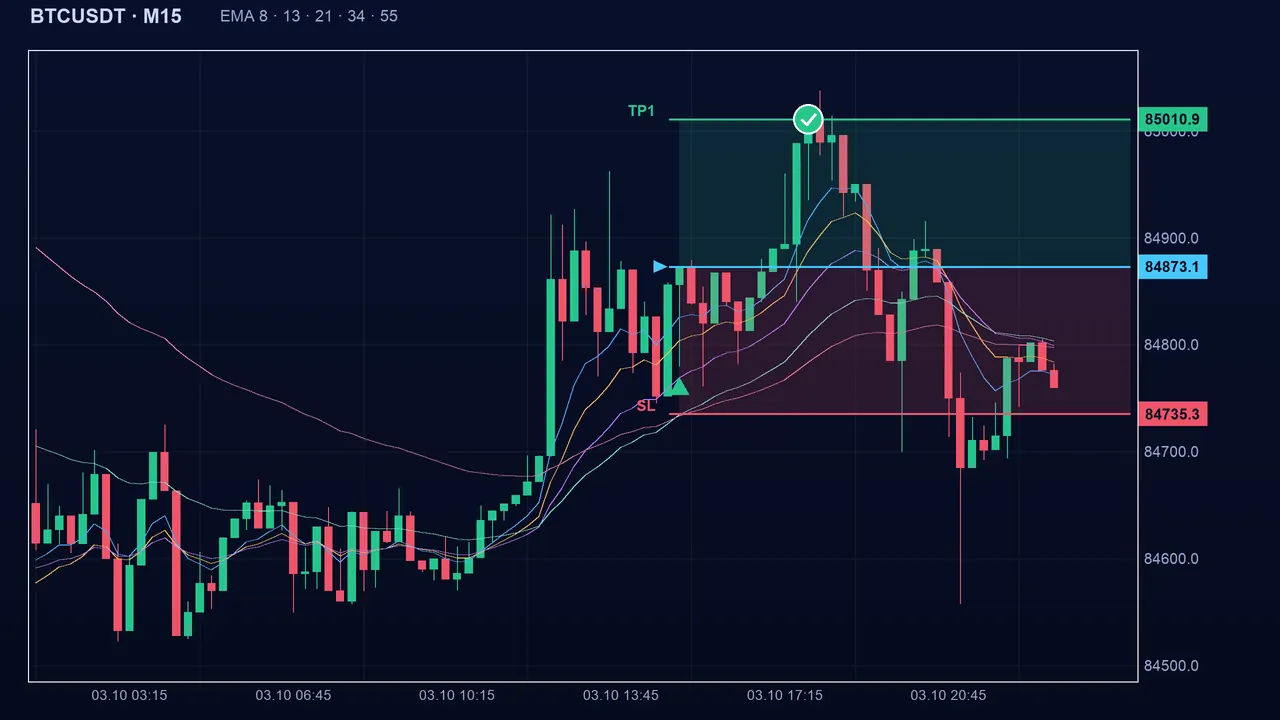
The settings
- The five periods (e1 to e5): 8, 13, 21, 34 and 55 by default, adjustable up to 100, 150, 200, 300 and 400 respectively.
- The shorter the periods, the faster the ribbon lines up, but the faster it comes apart.
- Keep e1 < e2 < e3 < e4 < e5: if you mix them up, the ribbon can never line up as intended and will stay neutral almost all the time.
The traps
For five averages to line up, a trend must already be well advanced: the ribbon is a late indicator. It can also line up one last time near a top, just before price turns around.
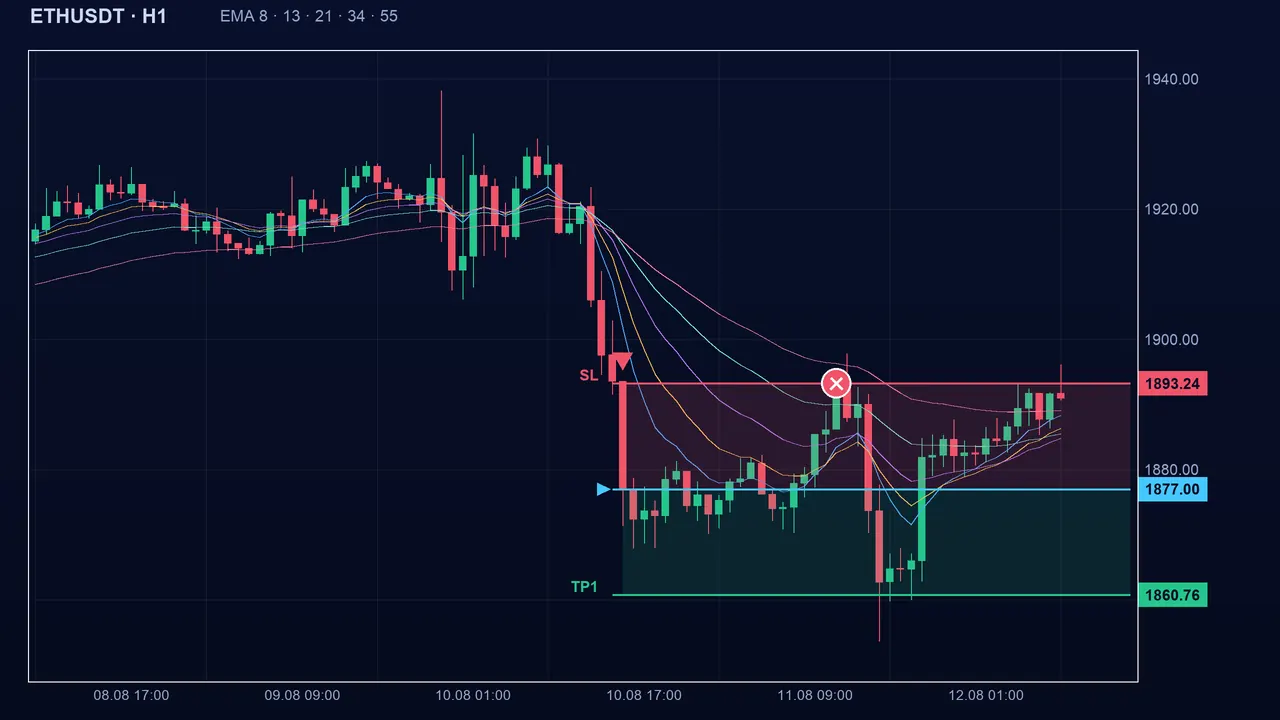
Key takeaways
- The ribbon compares five EMAs (8, 13, 21, 34, 55): bullish if ordered from fastest to slowest, bearish if reversed, neutral otherwise.
- It separates a clear trend from a confused market, but arrives after the move has started.
- Neutral does not mean safe: it simply means no alignment.
- Pair it with a volatility indicator (ATR) to size the stop, and with an oscillator to spot exhaustion.
📝 Lesson test
Log in to take this lesson’s test. Once you have passed all the tests, you will receive a certificate in your name.
Log inThese lessons are for understanding and are not investment advice. No method guarantees winning.