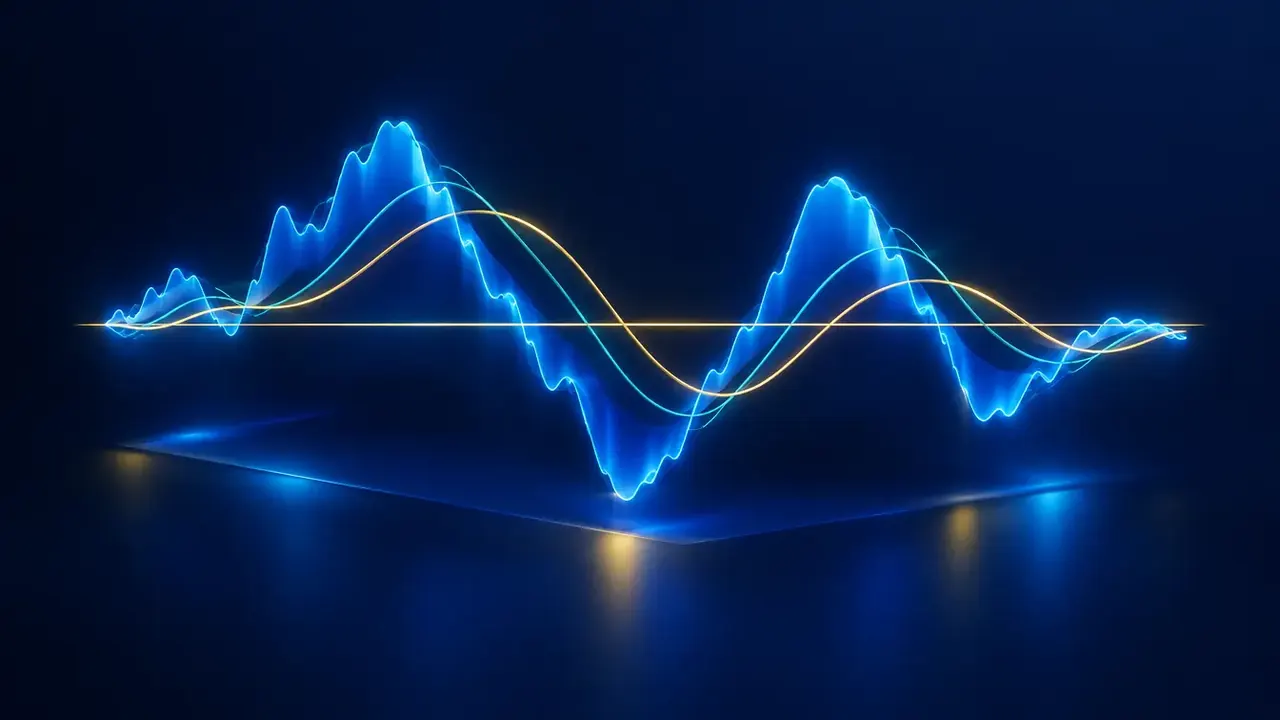
The RSI measures whether rises or falls dominate over the last candles, but its curve is often jagged. The Traders Dynamic Index (TDI) smooths this RSI with averages and looks for the moment momentum changes sides. In Algo Signals, it is a simplified version: without the volatility bands of the classic TDI, with three averages of the RSI.
How it is calculated
First we compute the Wilder RSI over 13 candles. Then three simple averages of this RSI: the midline over 34 candles (tdiBase), the fast line over 2 candles (tdiFast) and the slow line over 7 candles (tdiSlow). While the RSI cannot be computed yet, it is replaced by 50, the neutral value.
- Fast line: average of the last 2 RSI values. It almost follows the RSI.
- Slow line: average of the last 7 values. It serves as a calmer reference.
- Midline: average of the last 34 values. It tells whether the RSI is rather above or below its usual level.
Reading the signal in Algo Signals
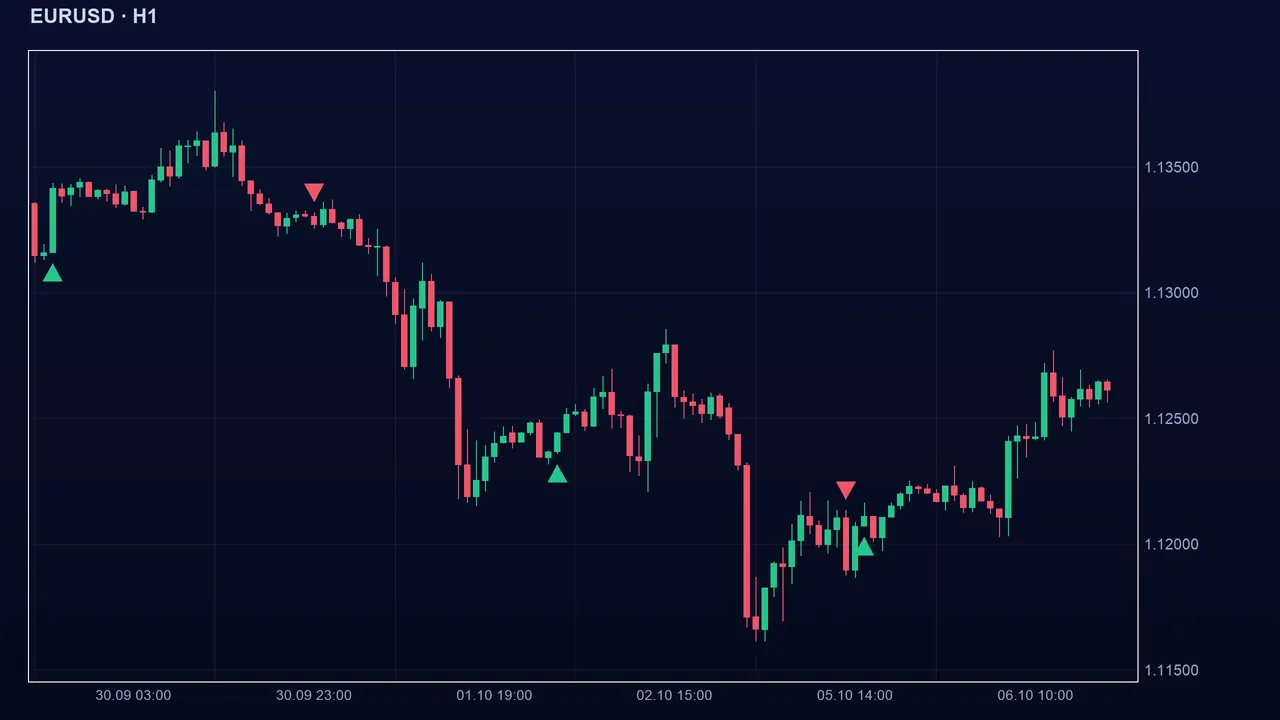
A buy appears when the fast line crosses up through the slow line AND the current RSI is above the midline. A sell appears when the fast line crosses down through the slow line AND the RSI is below the midline. The signal is a one-off, on the candle of the cross. The midline acts as a filter: a cross on the wrong side is ignored.
The settings
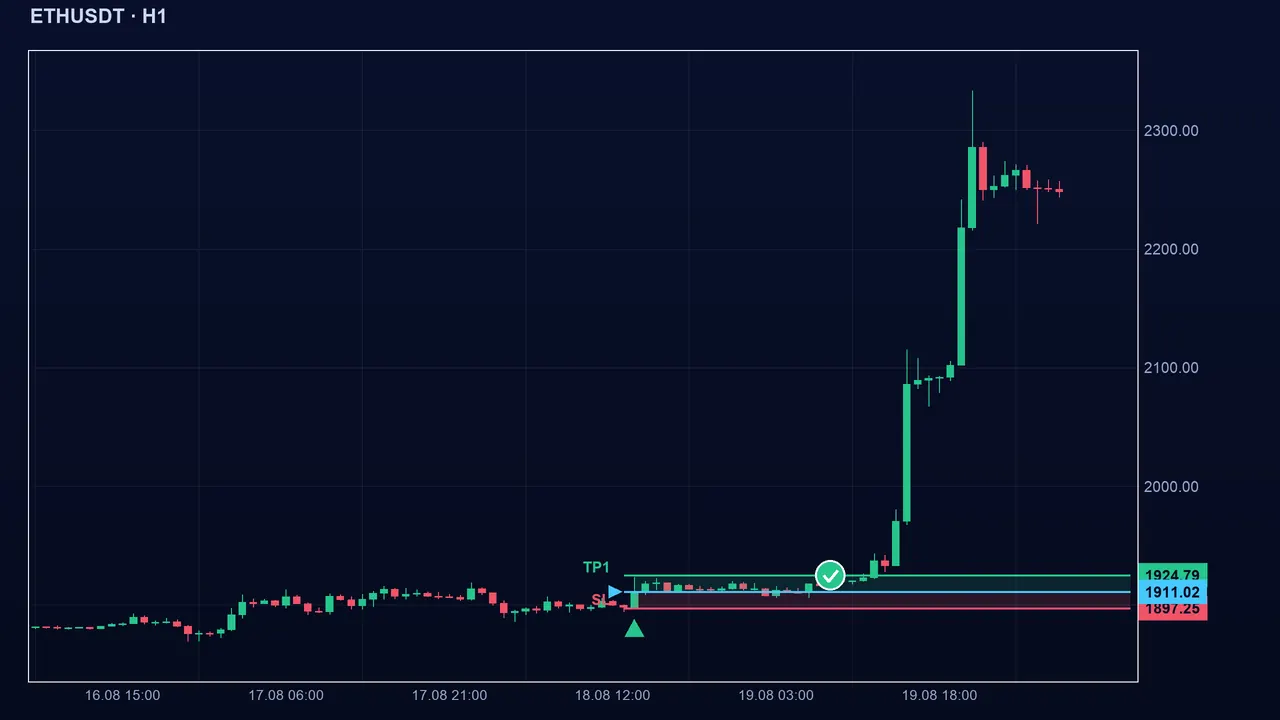
- RSI period (period, 13): smaller, the RSI is more nervous; larger, calmer.
- Midline (tdiBase, 34): larger, the filter becomes a steadier background reference.
- Fast line (tdiFast, 2) and slow line (tdiSlow, 7): the wider the gap between the two, the fewer the crosses, but the later they come.
The pitfalls
Key takeaways
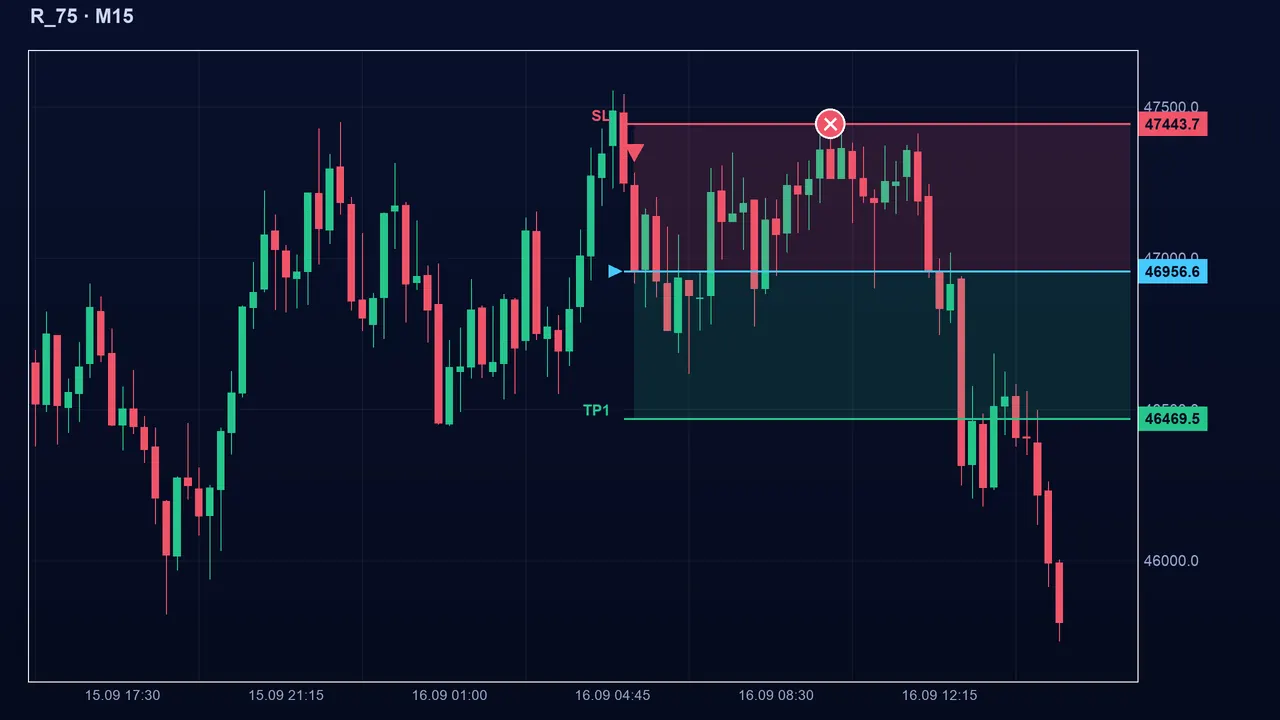
- TDI (Algo Signals version): RSI(13), fast line (2), slow line (7), midline (34).
- Buy: the fast crosses up through the slow and the RSI is above the midline. Sell: mirror.
- The midline is a filter, not a guarantee.
- In a trendless market, the RSI oscillates around 50 and crosses multiply.
📝 Lesson test
Log in to take this lesson’s test. Once you have passed all the tests, you will receive a certificate in your name.
Log inThese lessons are for understanding and are not investment advice. No method guarantees winning.