
What it is for
A support is a zone where price has already bounced up; a resistance is a zone where it has already stalled on the way up. Many traders watch them, which can make them useful: they help choose where to enter, where to place a stop-loss and where to aim for a target. But they are zones, not magic lines: price can go through them.
How they are calculated
Algo Signals first finds pivots: a peak is a high surrounded by 3 lower candles on each side (settings “candles to the left / right”: 3 and 3); a trough is the opposite. It then groups pivots whose prices are within 0.15% of each other, and keeps only groups touched at least 2 times.
It keeps at most 4 zones: the 2 closest resistances and the 2 closest supports to the last price. A zone above price is a resistance, a zone below is a support. They are calculated once over all the loaded history.
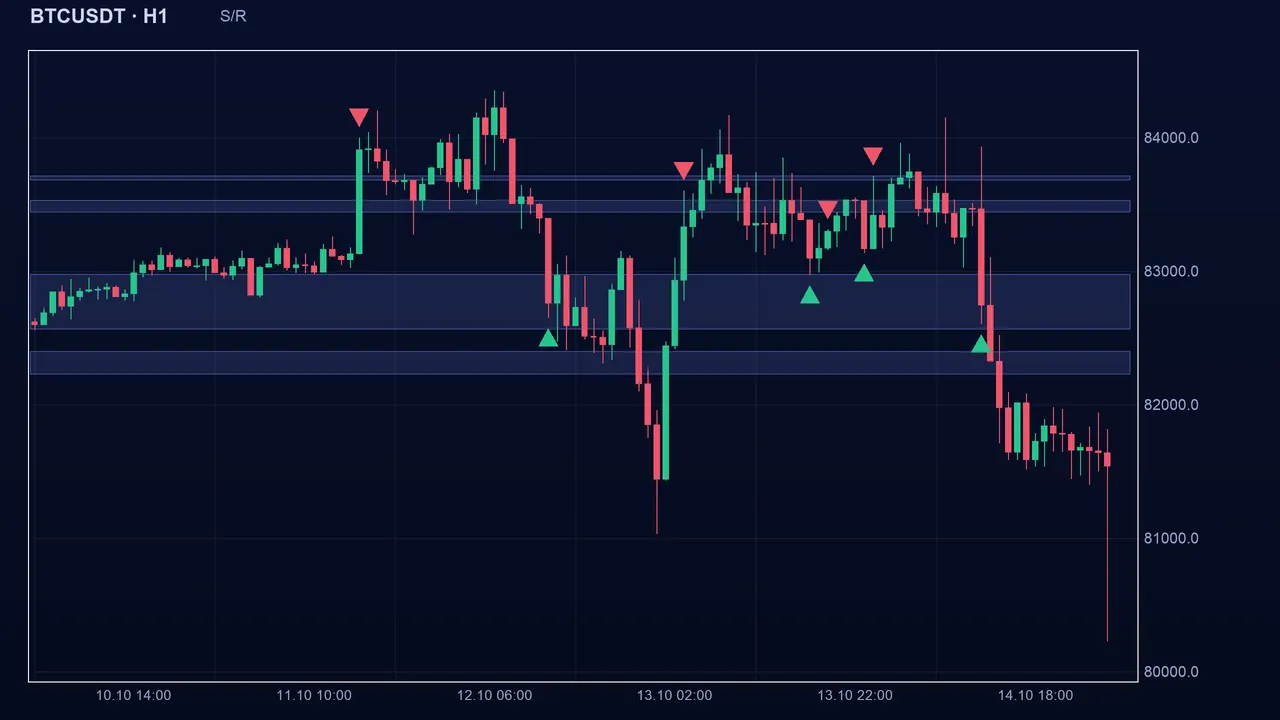
Reading the signal in Algo Signals
The indicator gives a state: “support” (+1) if the close is inside a support zone or within 0.25% of its edges, “resistance” (−1) if it is inside a resistance zone, otherwise neutral. It is a filter: with other trigger indicators ticked, a buy is kept only near a support and a sell only near a resistance. Alone, it gives its own signals.
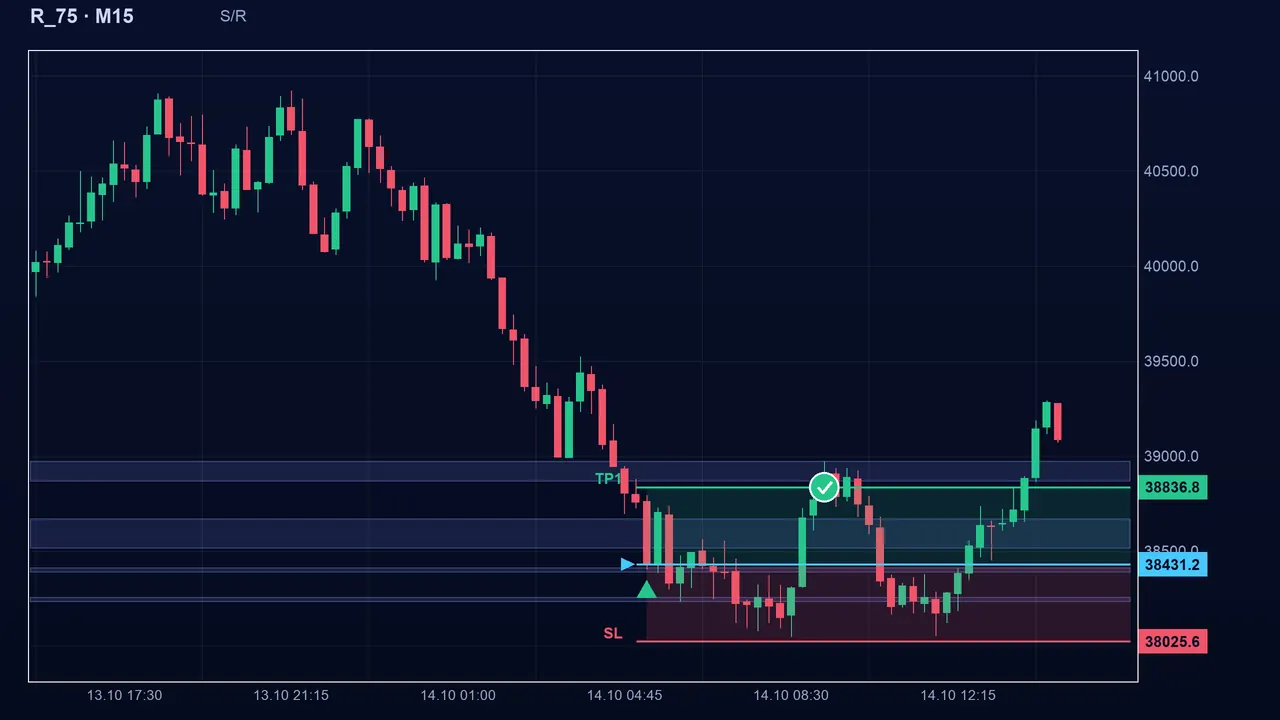
The settings
- Candles left / right: 3 and 3 (1 to 20). Tolerance: 0.15% (0.01% to 5%). Minimum touches: 2 (1 to 10). Maximum zones: 4 (2 to 20). Zone tolerance: 0.25% (0.01% to 5%).
- More candles on each side: fewer pivots, more significant, but confirmed later.
- More minimum touches: sturdier but rarer zones. A wider tolerance groups more pivots and widens the zones.
The pitfalls
A zone is not a wall: the more it is tested, the more likely it is to give way. And the zones are calculated over all the loaded history: on the past they look as if they “worked well” because they are drawn with hindsight. Live, the picture is less flattering. Finally, a broken support disappears from the list of supports.
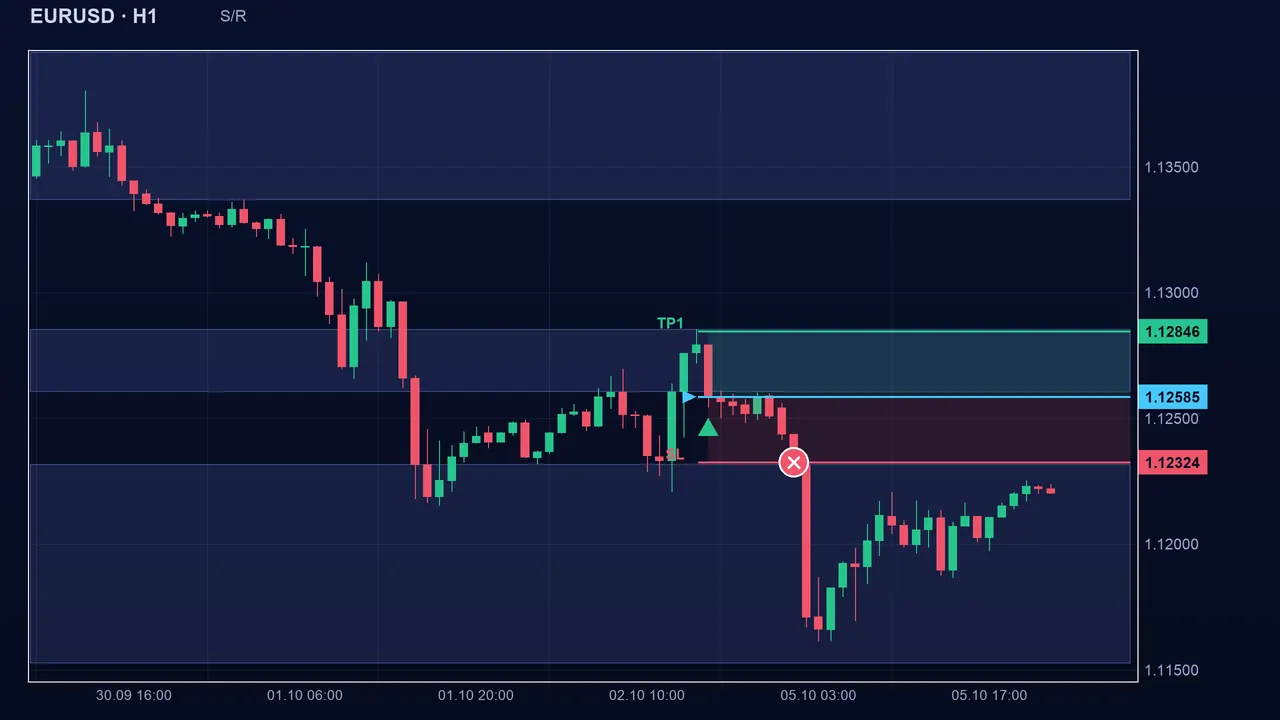
Key takeaways
- A zone = at least 2 close pivots (within 0.15%), up to 4 zones around the last price.
- State “support” or “resistance” if the close is inside the zone (0.25% margin); the indicator works as a filter.
- Zones are drawn over all the history: be wary of their apparent success on the past.
- In confluence: combine them with a trigger (crossover, RSI) and place the stop-loss beyond the zone.
📝 Lesson test
Log in to take this lesson’s test. Once you have passed all the tests, you will receive a certificate in your name.
Log inThese lessons are for understanding and are not investment advice. No method guarantees winning.